Nov 13, 2025
5 0
Bitcoin Price Decline Continues Below $105K, Eyes on $100K Support
- Bitcoin's price faces downward pressure after failing to surpass $105,500.
- Currently trading below $105,000 and the 100 hourly SMA.
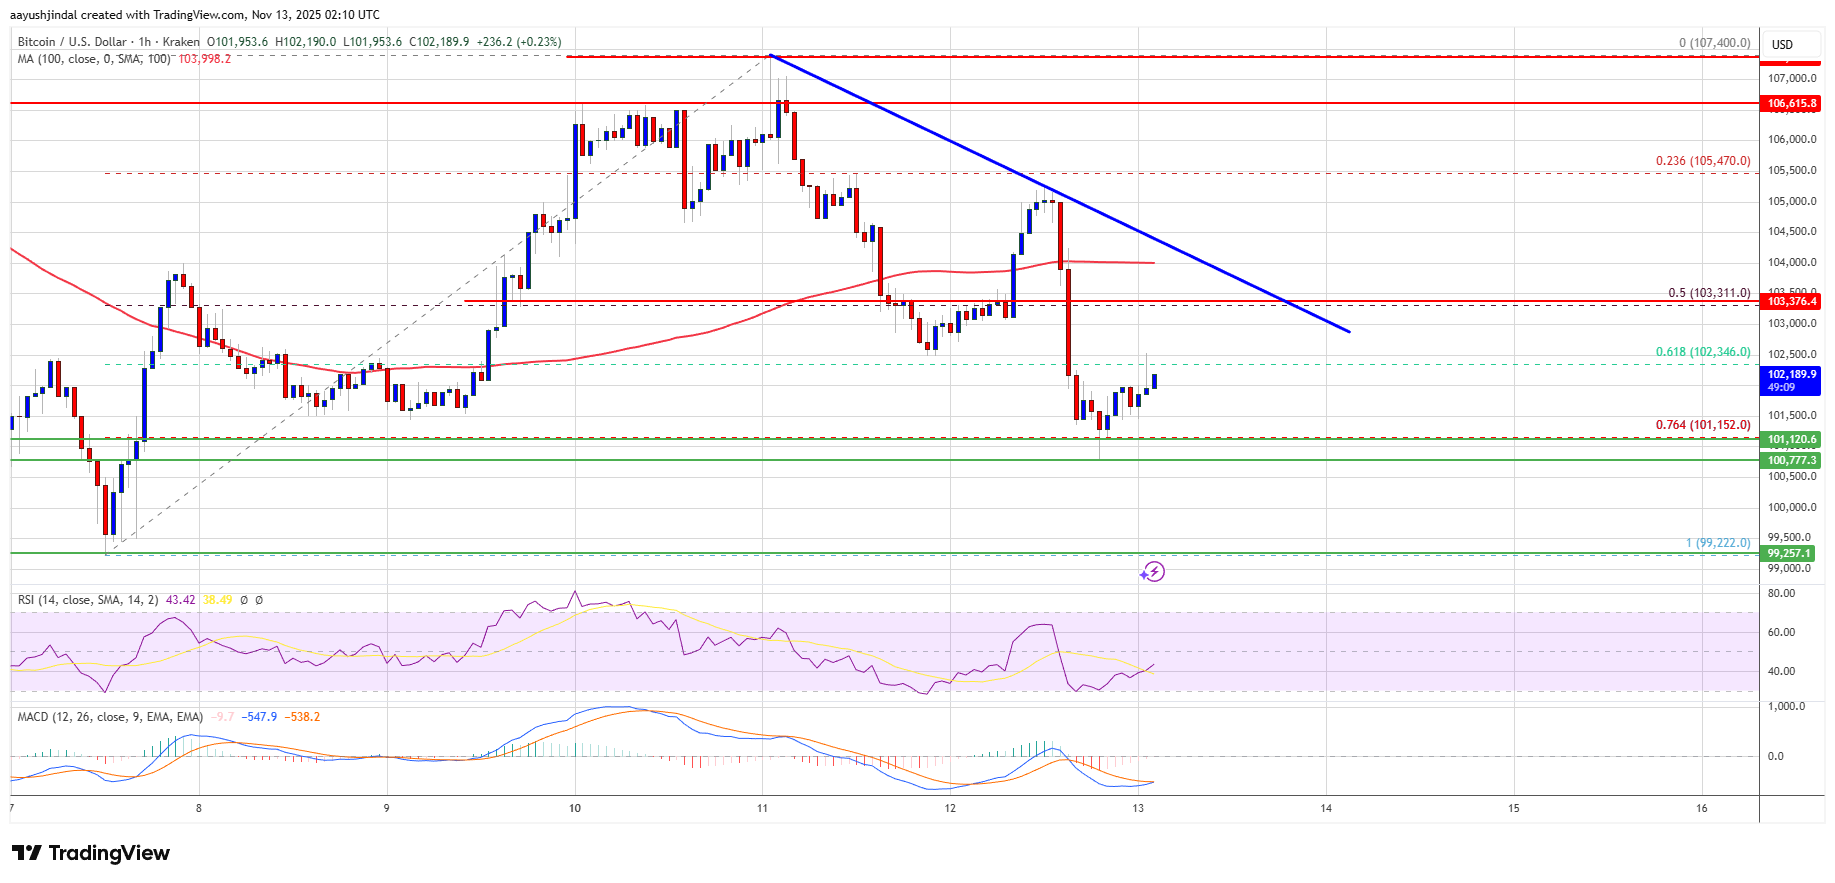
- A bearish trend line with resistance at $103,300 on the BTC/USD hourly chart from Kraken data.
- Further decline possible if Bitcoin trades below $101,200.
Price Analysis
- Recent high was $107,400, followed by a decline below $105,000 and $104,000.
- Price dipped under the 61.8% Fib retracement from $99,220 to $107,400.
- Resistance levels at $102,500, $103,250, and $103,500.
- If price exceeds $103,500, potential targets are $105,000 and $105,500.
Potential for Further Losses
- If unable to break $103,500 resistance, further declines expected.
- Immediate support at $101,200; major support at $100,500 and $100,000.
- Additional losses may lead to $98,800 and main support at $96,500.
Technical Indicators
- Hourly MACD indicates increasing bearish momentum.
- Hourly RSI is below 50, suggesting weaker buying strength.
- Major supports: $101,200, $100,500.
- Major resistances: $103,250, $103,500.