Nov 20, 2025
4 1
Bitcoin Faces Resistance at $93,500 Amid Decline Concerns
Bitcoin Price Analysis
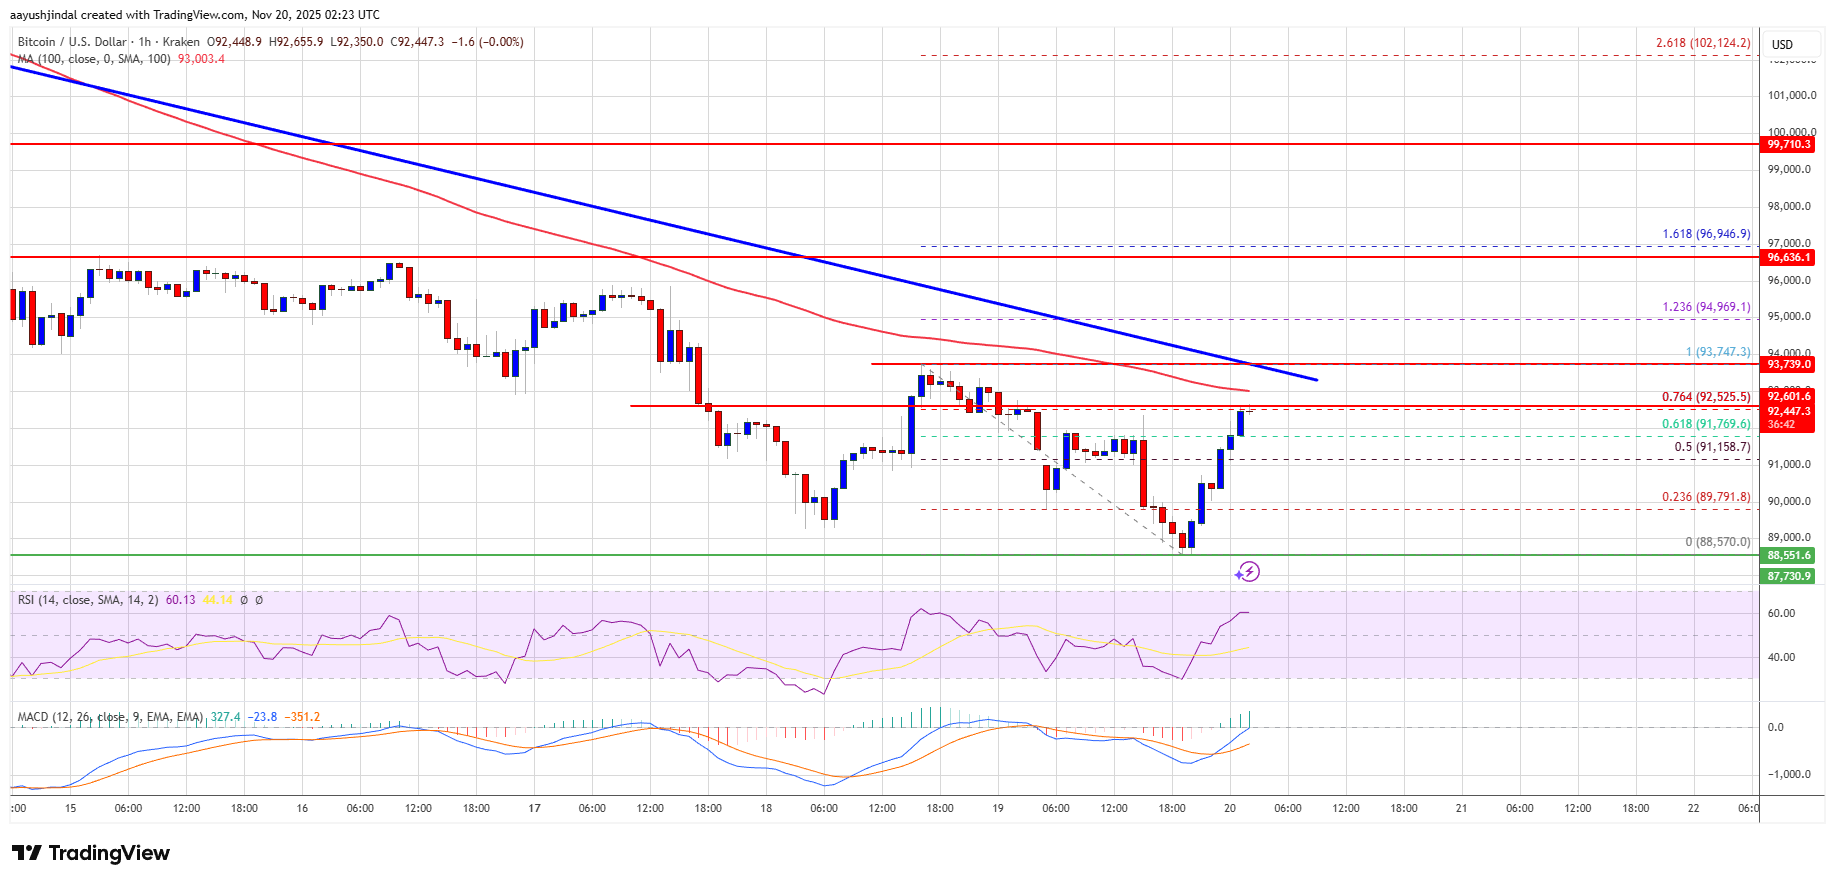
- Bitcoin is currently trading below $93,000 and the 100 hourly Simple moving average.
- A bearish trend line is forming with resistance at $93,500 on the BTC/USD hourly chart.
- BTC bears pushed the price lower, reaching a low of $88,570 before attempting recovery.
- The price faces resistance near $92,500 and $93,500 levels.
- A close above $93,750 might lead to further increases toward $94,500 and potentially $95,500.
Potential Decline
- If Bitcoin fails to surpass $93,500, another decline is possible.
- Immediate support is near $91,150, with major support at $90,500 and $90,000.
- The main support sits at $86,500; falling below this could accelerate losses.
Technical Indicators
- Hourly MACD: Losing pace in the bearish zone.
- Hourly RSI: Above the 50 level.
- Major Support Levels: $91,150, $90,500.
- Major Resistance Levels: $92,500, $93,500.