Feb 25, 2026
2 0
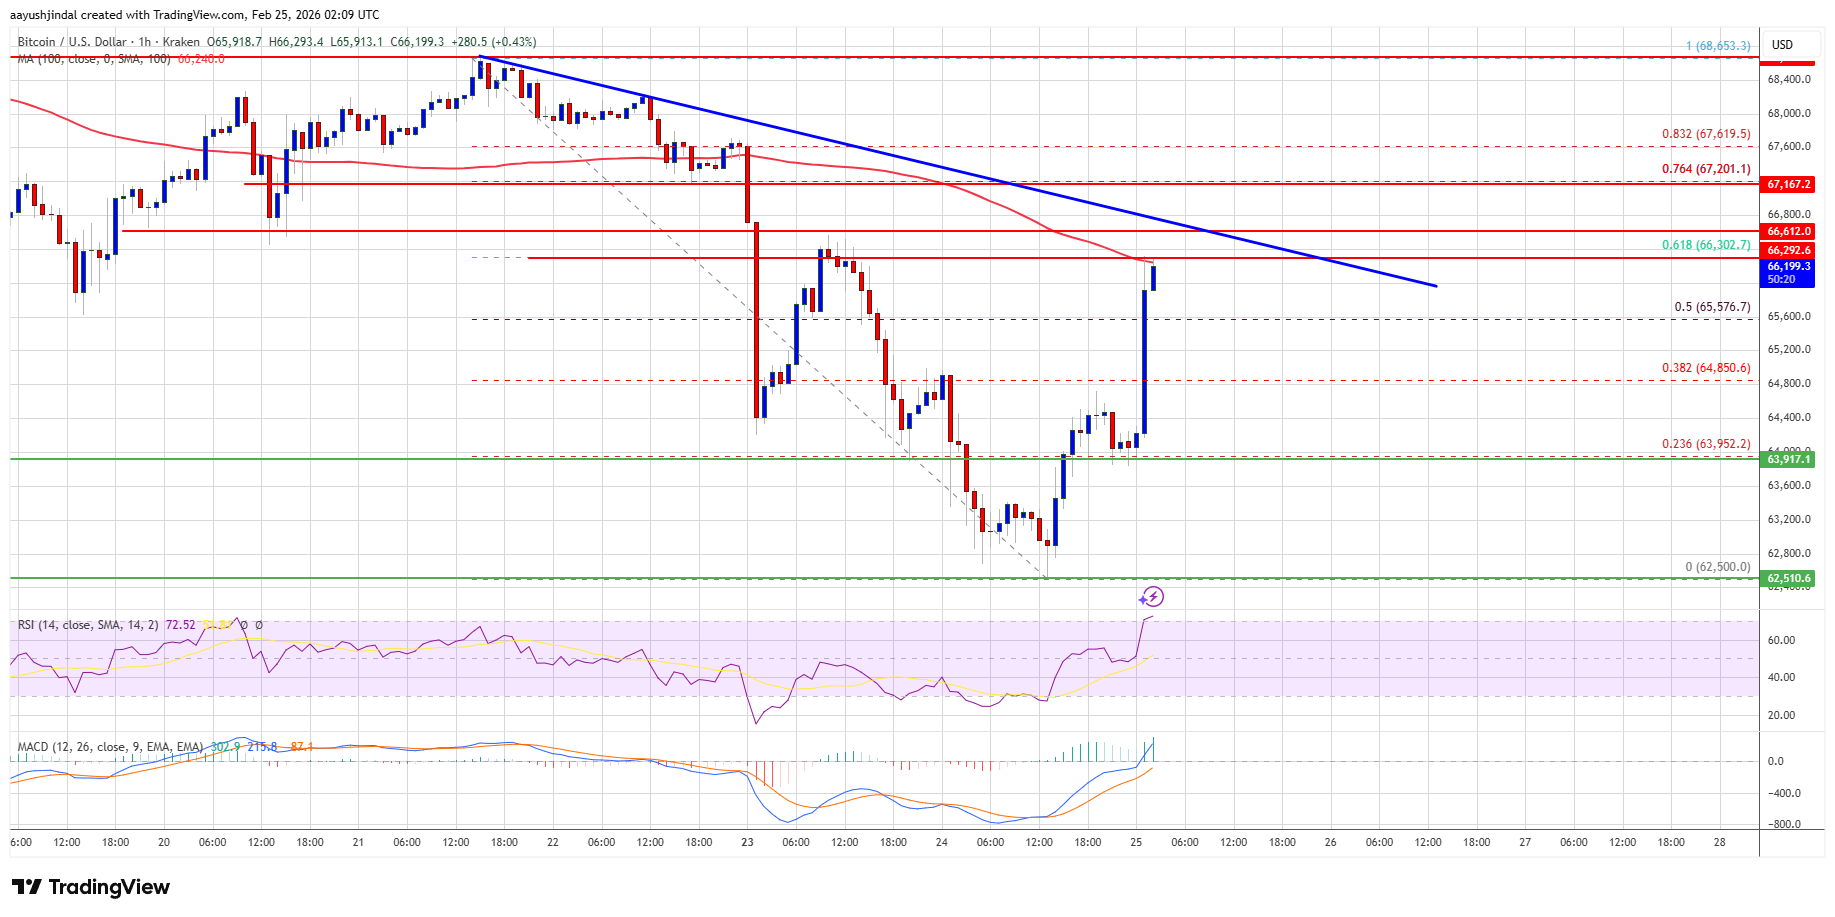
BEARISH 📉 : Bitcoin struggles below $66,500 amid bearish trendline resistance
Bitcoin Price Analysis
- Bitcoin's price dropped below the $65,000 support level and is now recovering from a low of $62,500.
- The price faces resistance near $66,500 and is trading below the 100 hourly simple moving average.
- A bearish trend line is forming with resistance at $66,600 on the BTC/USD hourly chart.
- If Bitcoin remains stable above $65,000, it could attempt to rise again. Immediate resistance is at $66,500, with key resistance at $67,200.
- Further gains might push the price towards $68,000, $68,800, or even $69,500.
Potential for Another Decline
- If Bitcoin cannot break the $66,500 resistance, another decline might occur with immediate support at $65,500 and major support at $65,000.
- Further losses could bring the price down to the $64,200 or $63,500 levels, with primary support at $62,500.
Technical Indicators:
- Hourly MACD: Gaining momentum in the bullish zone.
- Hourly RSI: Above the 50 level.
- Major Support Levels: $65,500, $65,000.
- Major Resistance Levels: $66,500, $67,200.