Dogecoin Approaches $0.1491 Resistance Level Amid Bullish RSI Signals
Dogecoin is poised for a potential breakout, with technical indicators suggesting movement toward the $0.1491 mark. The Relative Strength Index (RSI) indicates bullish momentum, implying increased buyer confidence and possible gains ahead.
RSI Signals Growing Bullish Sentiment For Dogecoin
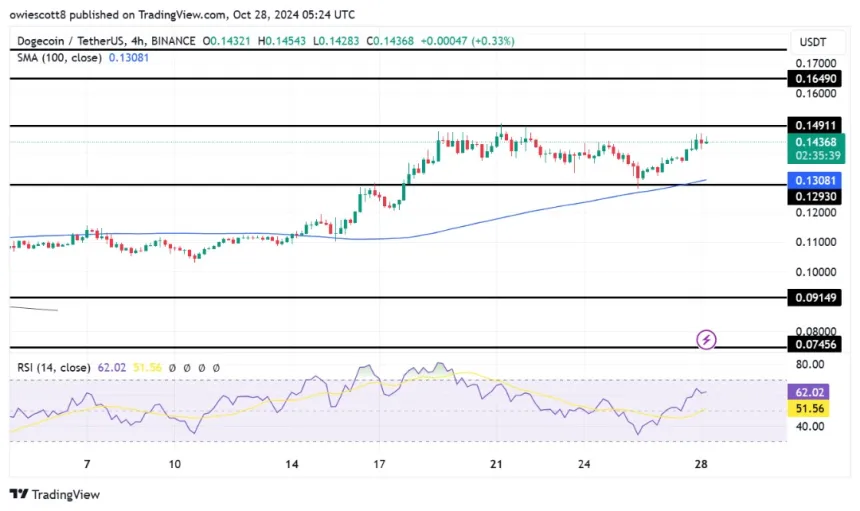
After recovering to $0.1293, DOGE's price continues to rise on the 4-hour chart, approaching the key resistance level of $0.1491. Trading above the 100-day Simple Moving Average (SMA) supports a positive trend and potential breakout.

The 4-hour RSI has rebounded to 62% from a previous low of 34%, indicating optimism about future performance. Continued upward momentum may lead to significant price increases and challenge resistance levels.
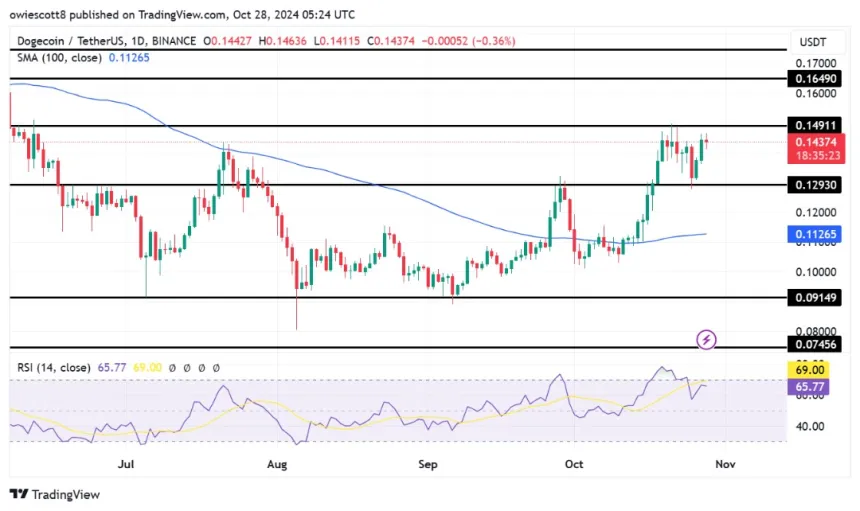
On the daily chart, Dogecoin exhibits strong upward movement, evidenced by multiple positive candlesticks following the rebound at $0.1293. Trading above the 100-day SMA suggests a bullish phase and that former resistance levels may now act as support.

The 1-day chart shows the RSI signal line rising to 64% after previously dropping to 57%, reinforcing a sustained optimistic outlook for DOGE.
Potential Upside Targets: What Lies Beyond $0.1491?
As Dogecoin approaches the $0.1491 resistance level, potential targets emerge for a breakout. If DOGE surpasses this threshold, the next target could be around $0.1649, where historical resistance may be encountered. Sustained bullish momentum could enable DOGE to test higher price levels.
If upward strength cannot be maintained, DOGE might retrace to the support level of $0.1293. Breaching this level could trigger declines toward $0.0914 and lower price ranges.
