Dogecoin Bollinger Bands Tighten to Levels Not Seen Since 2021
Dogecoin has experienced significant price action and increased trading volume recently, leading the market in inflows and outperforming Bitcoin. This shift has positively affected Dogecoin's technical outlook, particularly regarding the Bollinger Bands on the DOGE/BTC chart.
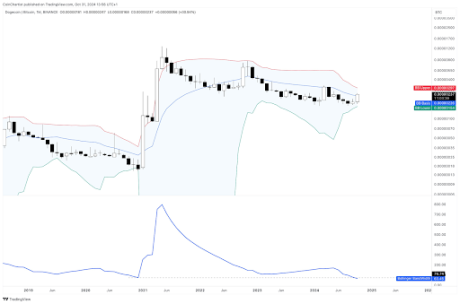
Crypto analyst Tony Severino highlighted that the Bollinger Bands have tightened to a level not seen in years, even more so than before Dogecoin's 2021 rally.
Dogecoin Bollinger Bands Squeeze To Tightest Level
Bollinger Bands are technical indicators used to mark price volatility boundaries. A squeeze indicates low volatility, while widening bands suggest high volatility. Currently, the DOGE/BTC Bollinger Bands are at their tightest on the monthly timeframe, reminiscent of conditions just before the 2021 rally that led to significant price increases.

If historical patterns hold, Dogecoin may be poised for a strong rally in the coming months, potentially exceeding returns from the 2024 rally.
DOGE Breakout From Three-Year Channel
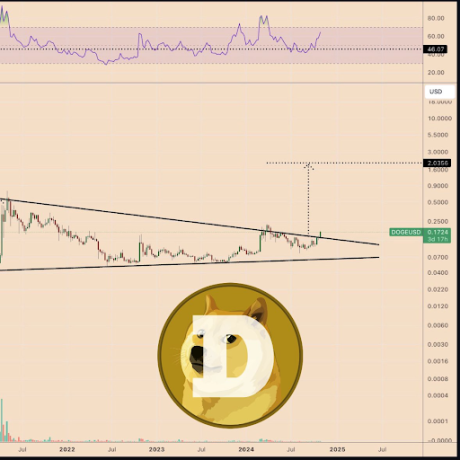
Dogecoin's recent rally includes a 72% increase, reaching $0.176, its highest in over six months. This breakout occurred from a three-year downward channel pattern, marking a significant move beyond a key resistance level established since the 2021 peak.

The likelihood of further price increases is high due to this breakout, though a retest is possible. Analysts suggest a potential target of $2 if momentum continues, although notable resistance levels exist at the 2024 high of $0.22 and the all-time high of $0.7316.
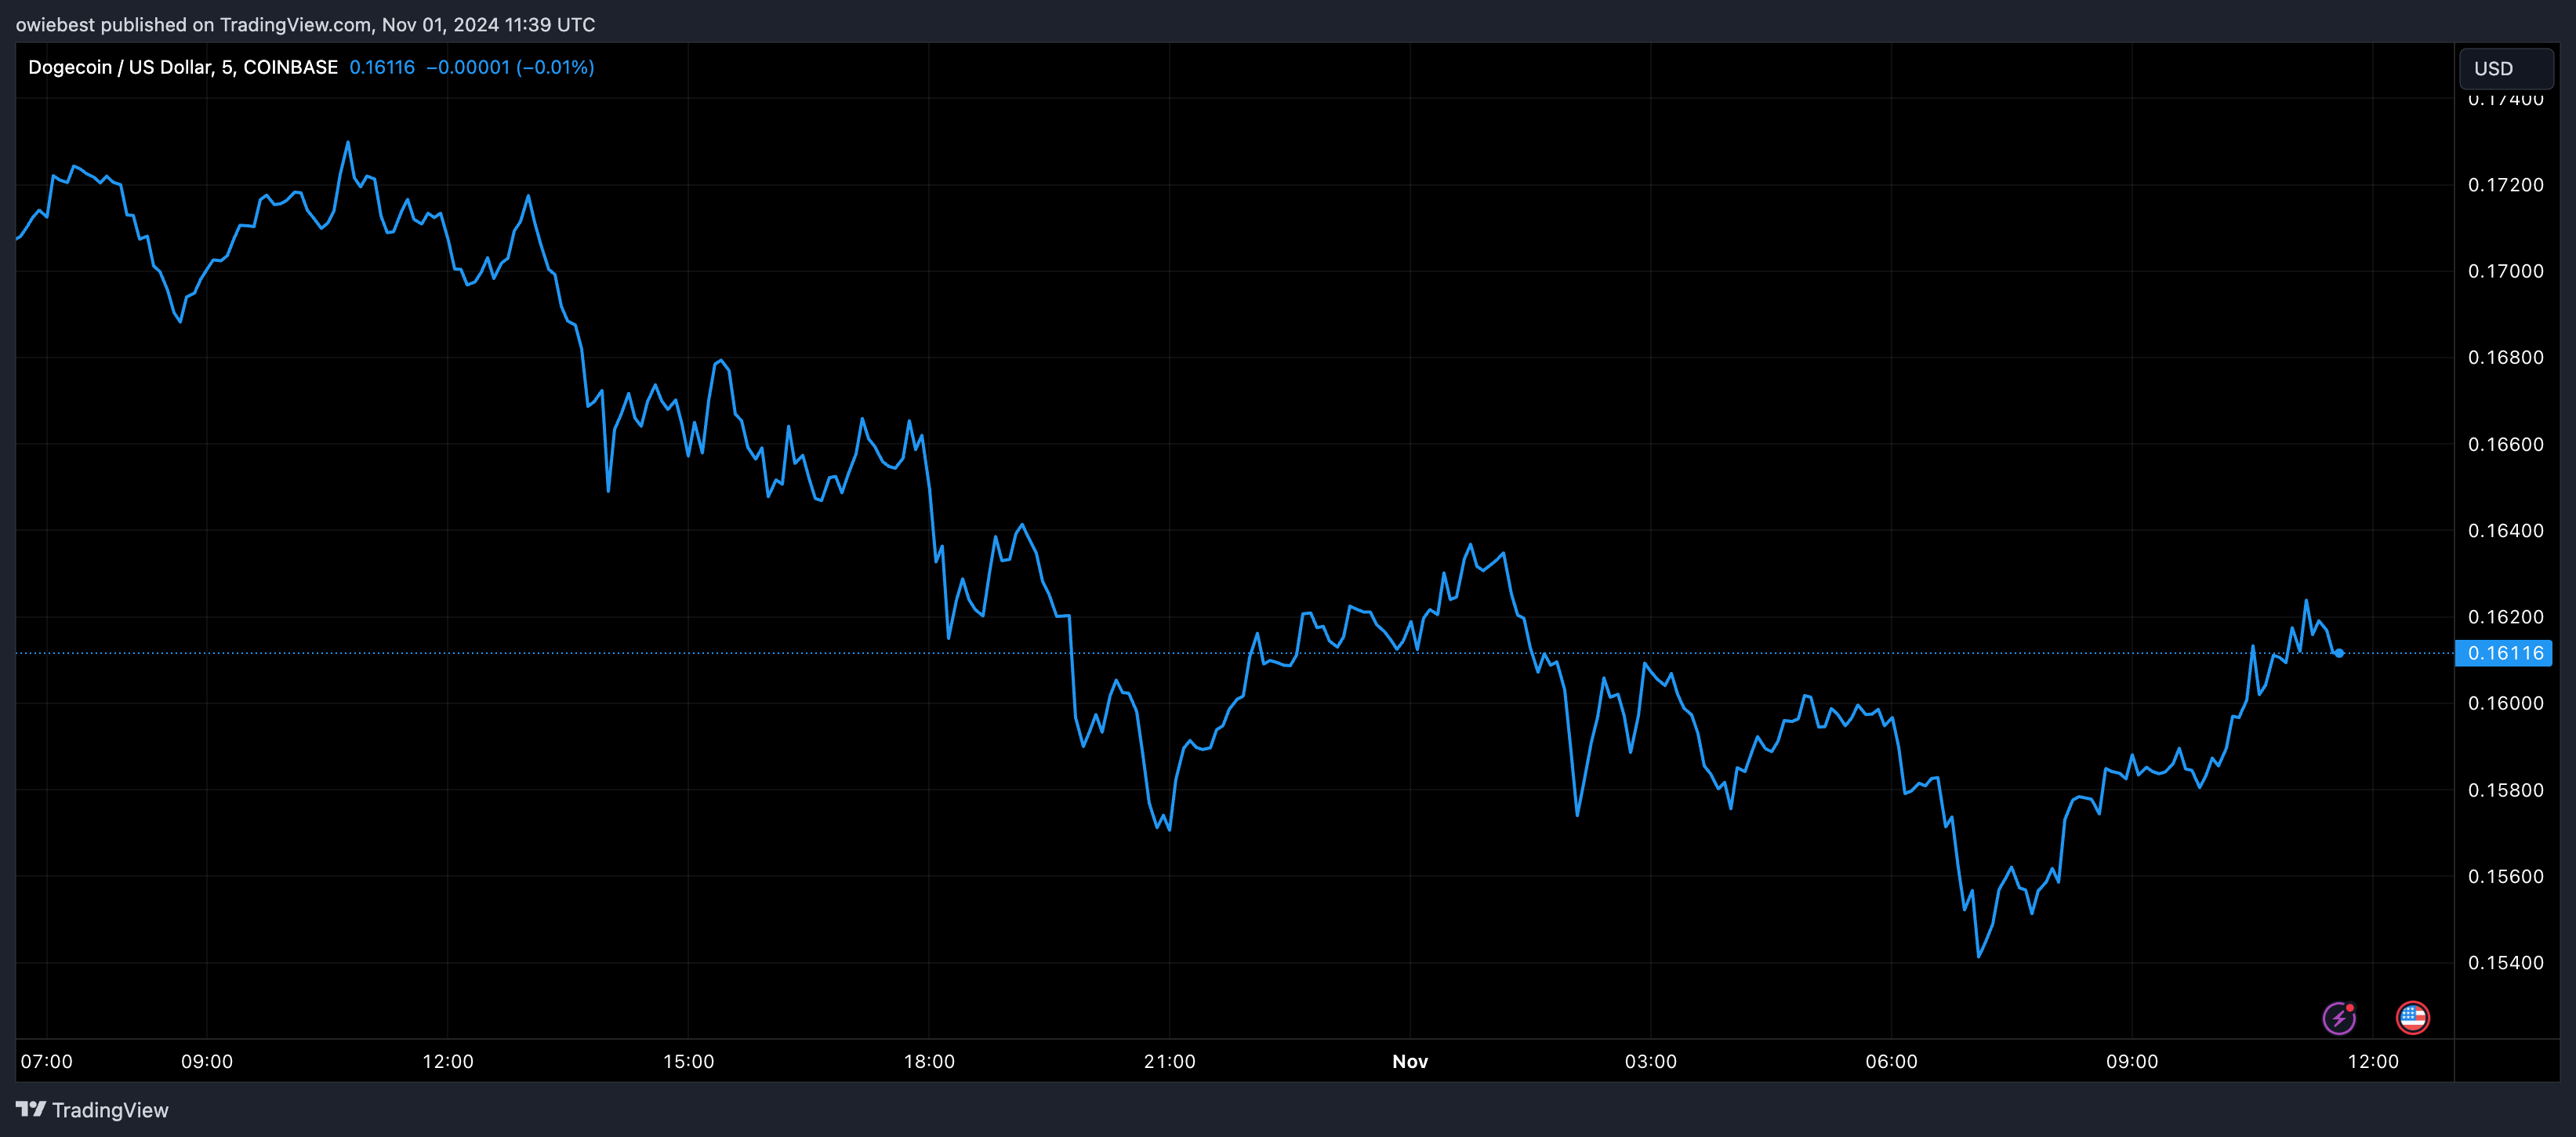
Currently, Dogecoin trades at $0.1585, approximately 10% lower from its peak of $0.176 as it retests the channel breakout.
