Dogecoin Forms Descending Triangle Pattern Indicating Potential Price Movement
An analyst has identified a potential price target for Dogecoin based on a Descending Triangle pattern.
Dogecoin's Current Descending Triangle Formation
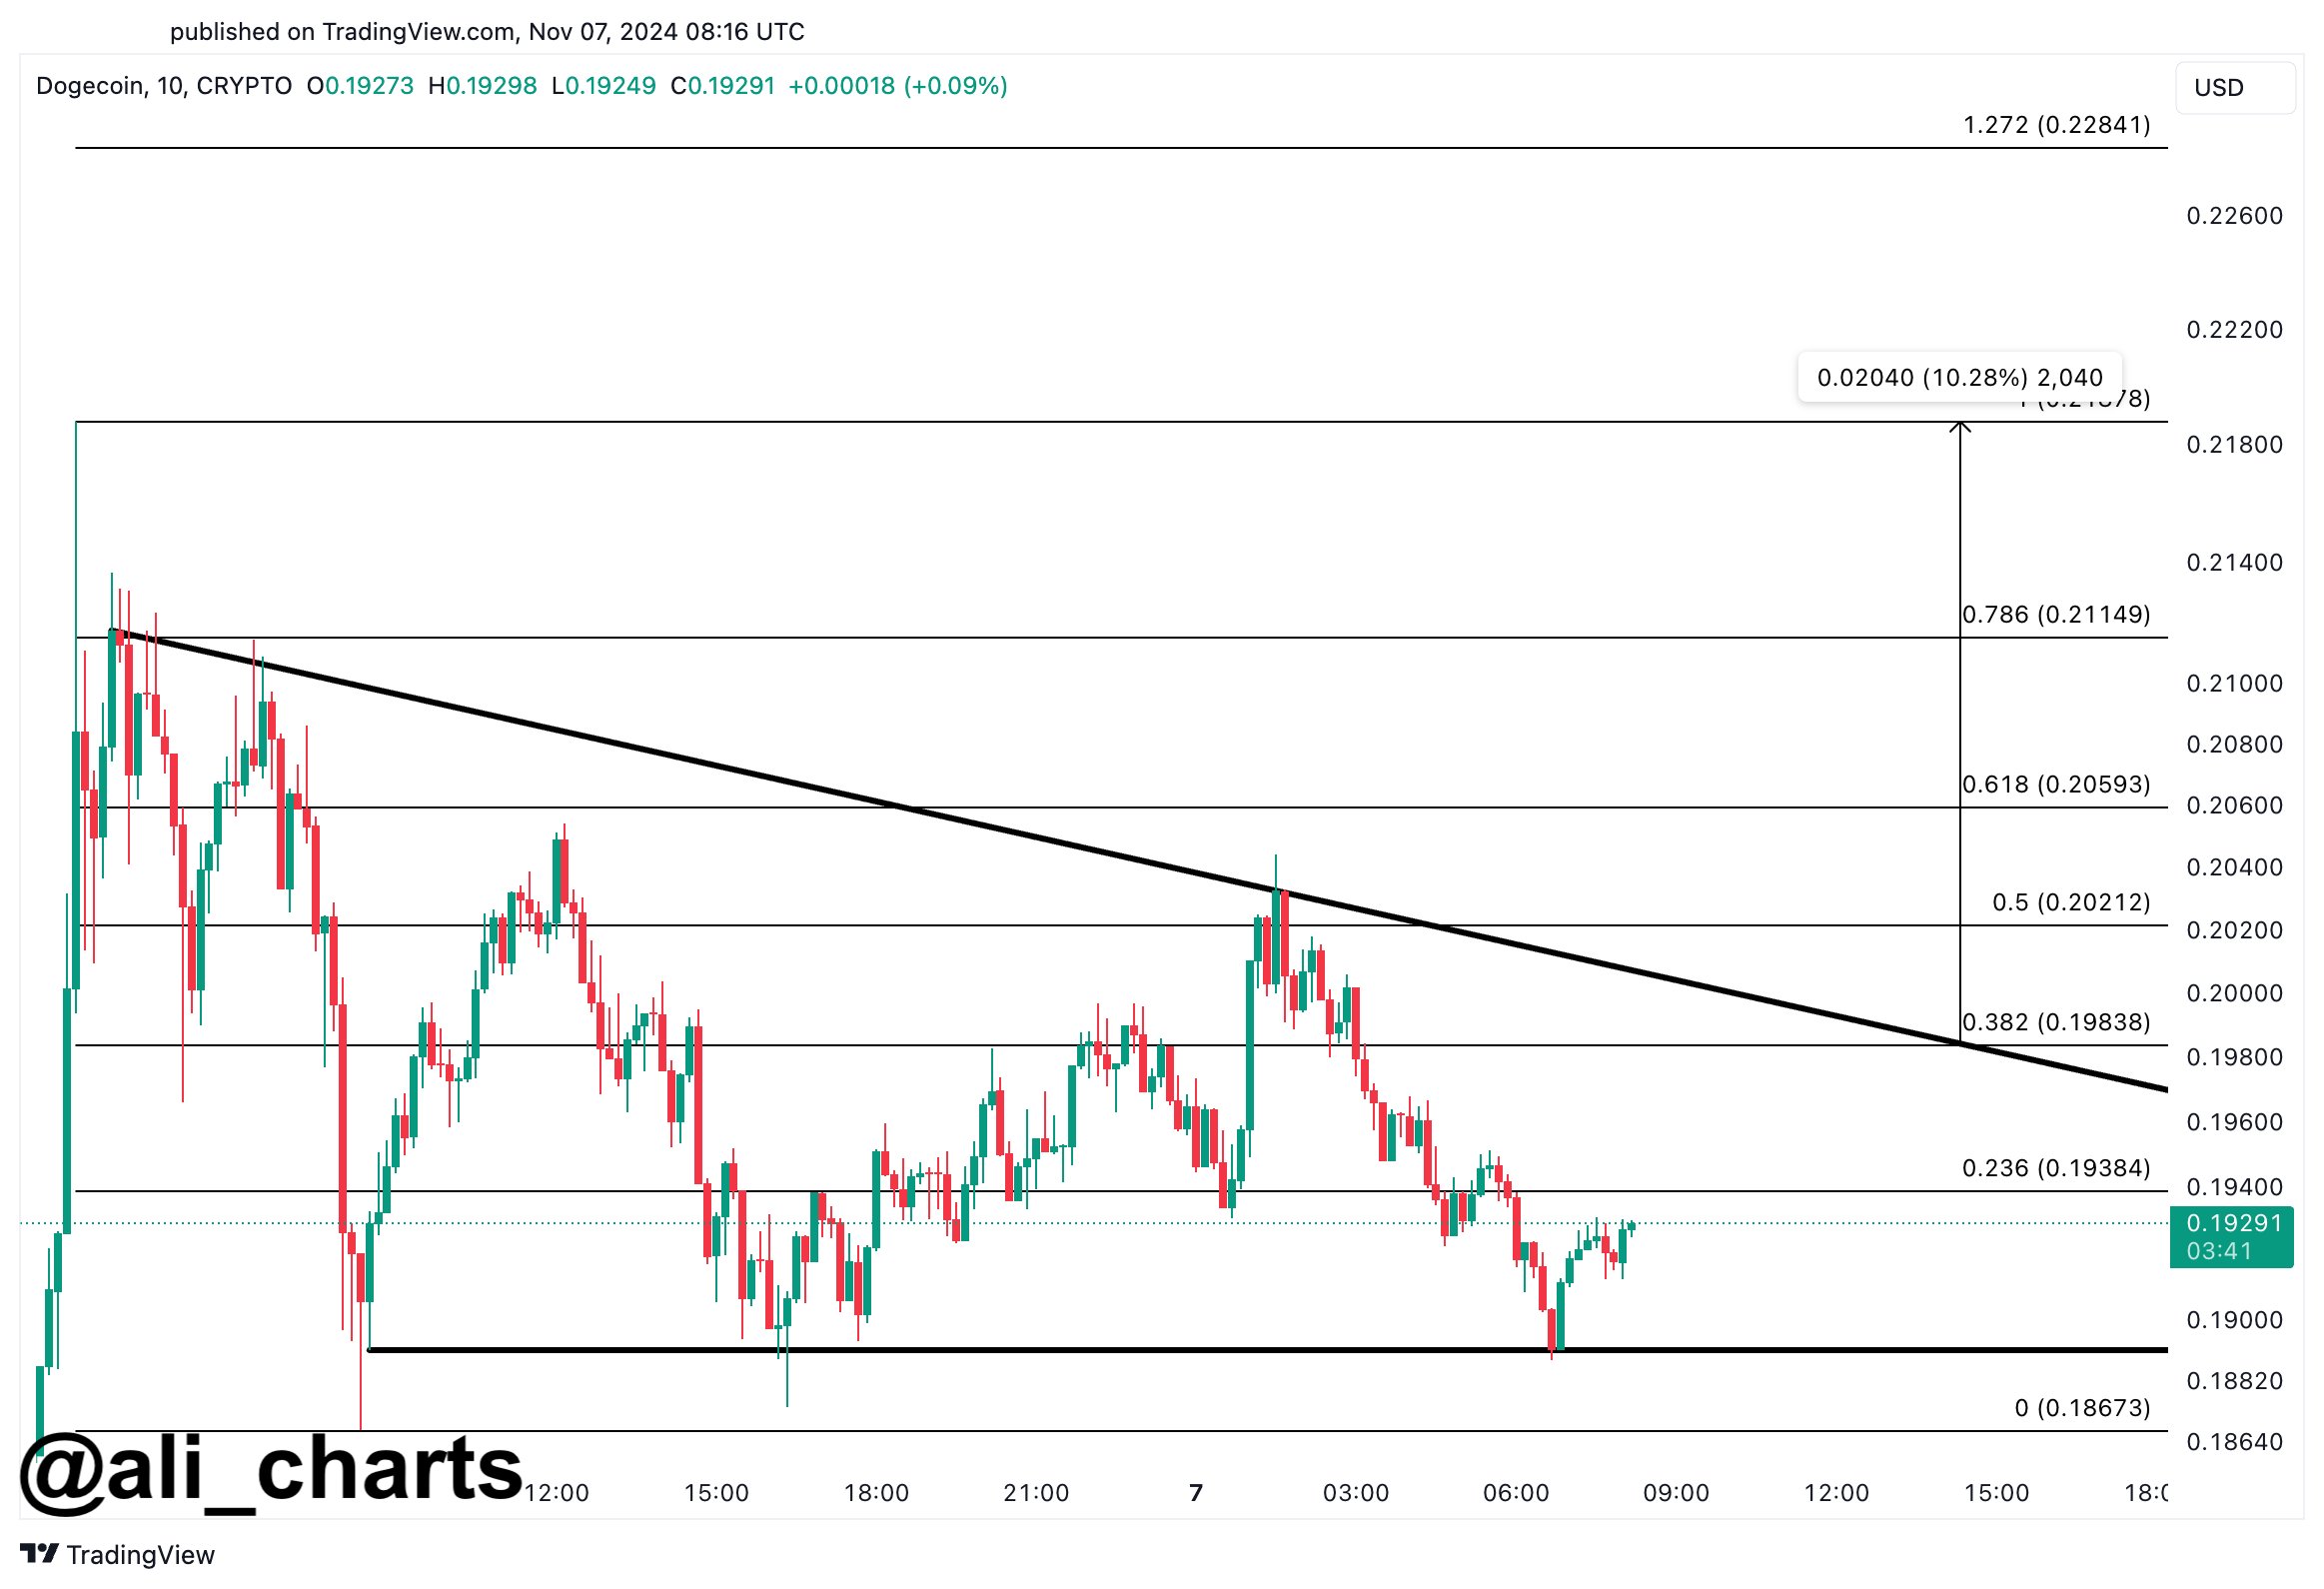
Analyst Ali Martinez discussed a Descending Triangle pattern forming in Dogecoin's price. This pattern consists of two lines: an upper line with a negative slope that may act as resistance and a lower line parallel to the time axis that serves as support.
A breakout from either level could indicate a continuation of the prevailing trend: a surge above the triangle suggests bullish momentum, while a drop below indicates bearish potential.
Other triangle patterns in technical analysis include the Ascending Triangle, which slopes upward instead of downward.
The chart shared by the analyst illustrates the Descending Triangle in which Dogecoin is currently moving:

The graph shows Dogecoin recently retesting the bottom level of the triangle and finding support. The cryptocurrency may approach the upper line near $0.198, where it has encountered resistance multiple times, suggesting the possibility of another rejection.
If Dogecoin breaks above the $0.198 resistance, it could experience a notable increase, with Martinez noting, "Breaking above the $0.198 resistance could spark a 10% move up to $0.220." A rise to this target would represent over 15% growth from the current price, making future developments in DOGE's trajectory significant.
DOGE Price Overview
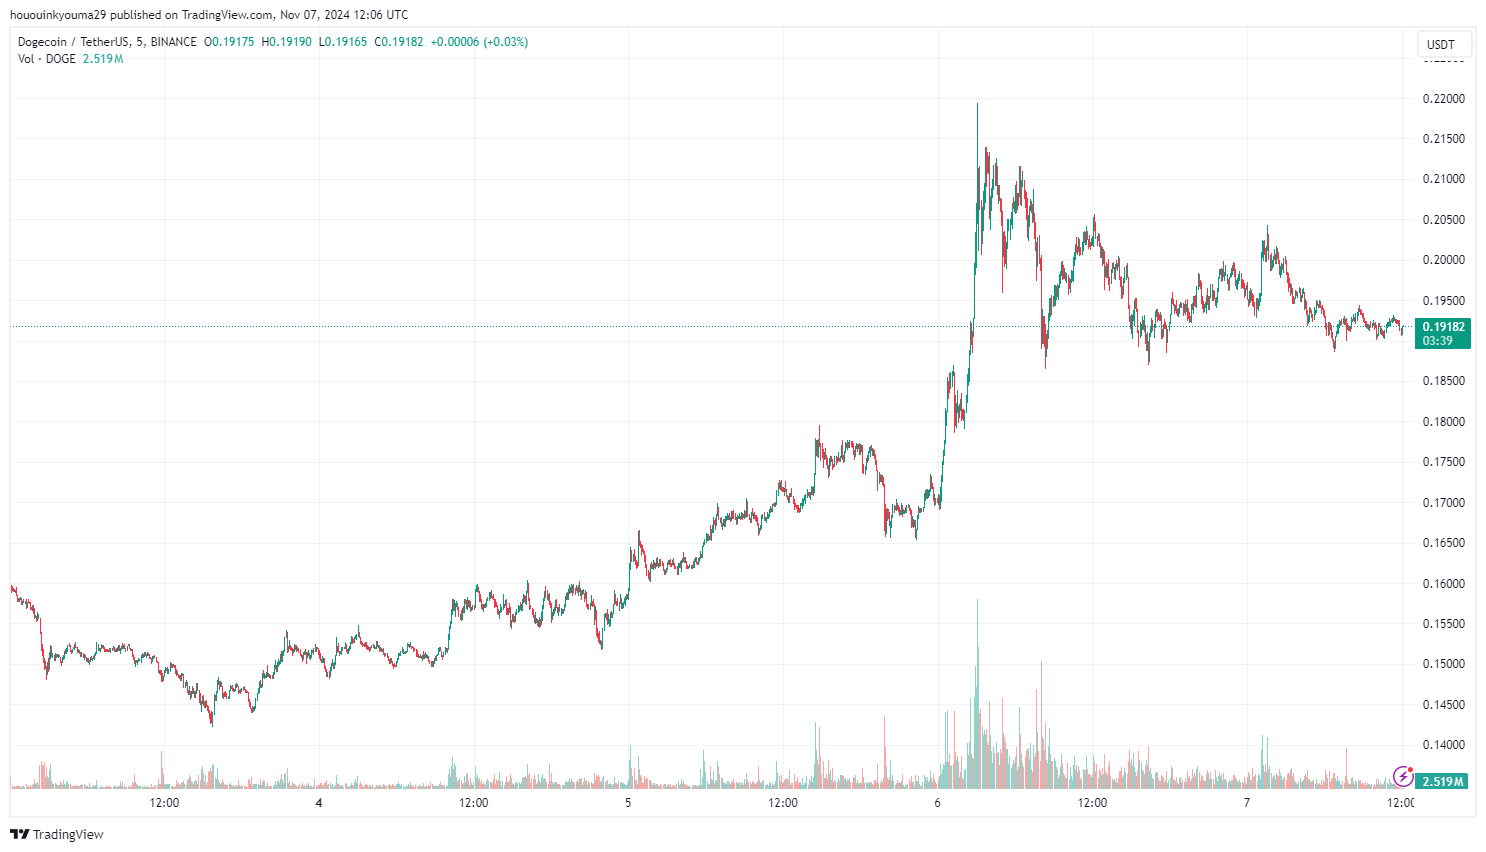
Dogecoin saw a significant rally following the recent US presidential elections, reaching close to $0.220 before pulling back to below $0.192.
Below is a chart showing Dogecoin's price movement over the past few days:
