Jun 29, 2025
2 0
Dogecoin Shows Double Bottom Pattern Indicating Potential Move to $0.47
Dogecoin is currently undergoing a potential accumulation phase, marked by the formation of a double bottom pattern on the weekly chart. This pattern typically indicates strong trend reversals, attracting trader attention for possible bullish momentum.
Key Points
- The critical support level is at $0.142, previously tested in April 2025.
- A breakout above the neckline resistance at $0.26 could validate the bullish reversal and target $0.47.
- The ADX indicator shows a weakening downtrend, suggesting a possible direction shift.
- The Relative Strength Index (RSI) remains just below the neutral 50 level; crossing above would strengthen the bullish outlook.
- Market optimism around the potential approval of a spot DOGE ETF may also influence price action.
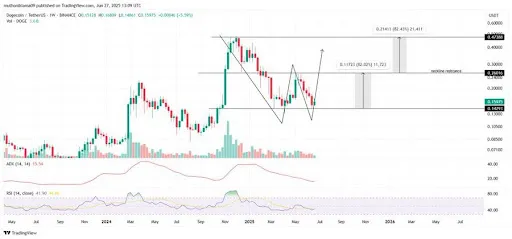
Current technical conditions indicate that if sentiment remains favorable, Dogecoin could be poised for a significant upward movement toward the $0.47 target.
