Jan 20, 2026
2 0
Dogecoin could outperform as capital shifts from NVIDIA-like leaders
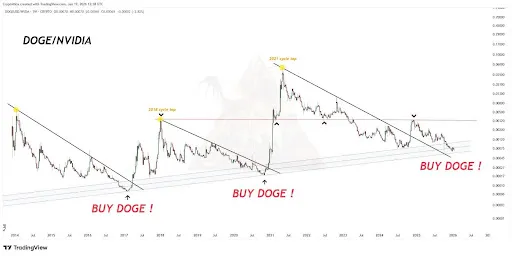
The analysis compares the performance of Dogecoin to NVIDIA by examining capital flows rather than narratives. A chart by @Cryptollica highlights this comparison across multiple market cycles, focusing on relative performance.
Key Insights from the Dogecoin—NVIDIA Chart
- The DOGE-to-NVIDIA ratio tracks relative performance, showing where capital has historically generated higher returns.
- In past cycles (2017 and 2021), this ratio hit a support area, with NVIDIA already realizing gains while Dogecoin was undervalued.
- This led to Dogecoin outperforming as speculative capital rotated into higher-risk assets.
The current market structure mirrors previous conditions, with the ratio again testing long-term support. This indicates an imbalance: Nvidia's gains are priced in, while Dogecoin remains undervalued.
Implications for Dogecoin
- The rotation pattern suggests capital may shift from established leaders like NVIDIA to higher beta assets like Dogecoin.
- Historically, Dogecoin has benefited during such transitions due to its sensitivity to sentiment and liquidity conditions.
- If the historical support holds, Dogecoin could see relative outperformance akin to past cycles.
The chart underscores a recurring structural relationship between capital leaders and speculative assets, dependent on liquidity and risk appetite. This pattern reflects consistent historical behavior observed across market cycles.