Jan 27, 2026
2 0
BULLISH 📈 : Dogecoin reversal likely as RSI divergence signals momentum shift
Dogecoin's price action shows potential signs of trend reversal:
- Technical analysis indicates a developing double-bottom structure and RSI divergence near long-term support around $0.12.
- RSI divergence suggests weakening bearish momentum, which has historically preceded relief rallies for Dogecoin.
- The double bottom along a descending channel points to possible sell-side exhaustion.
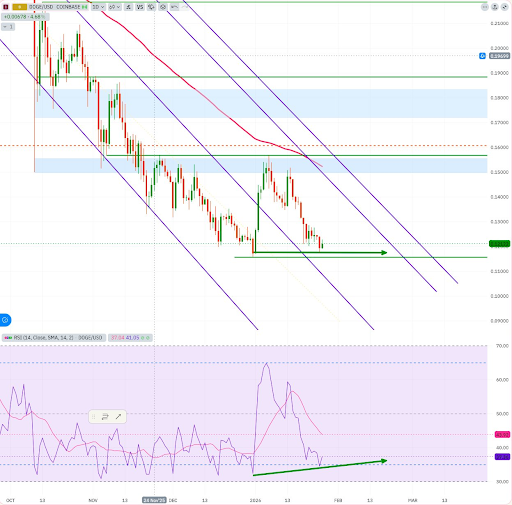
- A move above $0.16 could validate the RSI divergence and double bottom; breaking above $0.31 may trigger a significant rally.
- Historical chart patterns suggest a potential large-scale breakout, similar to a 331% surge in late 2024.
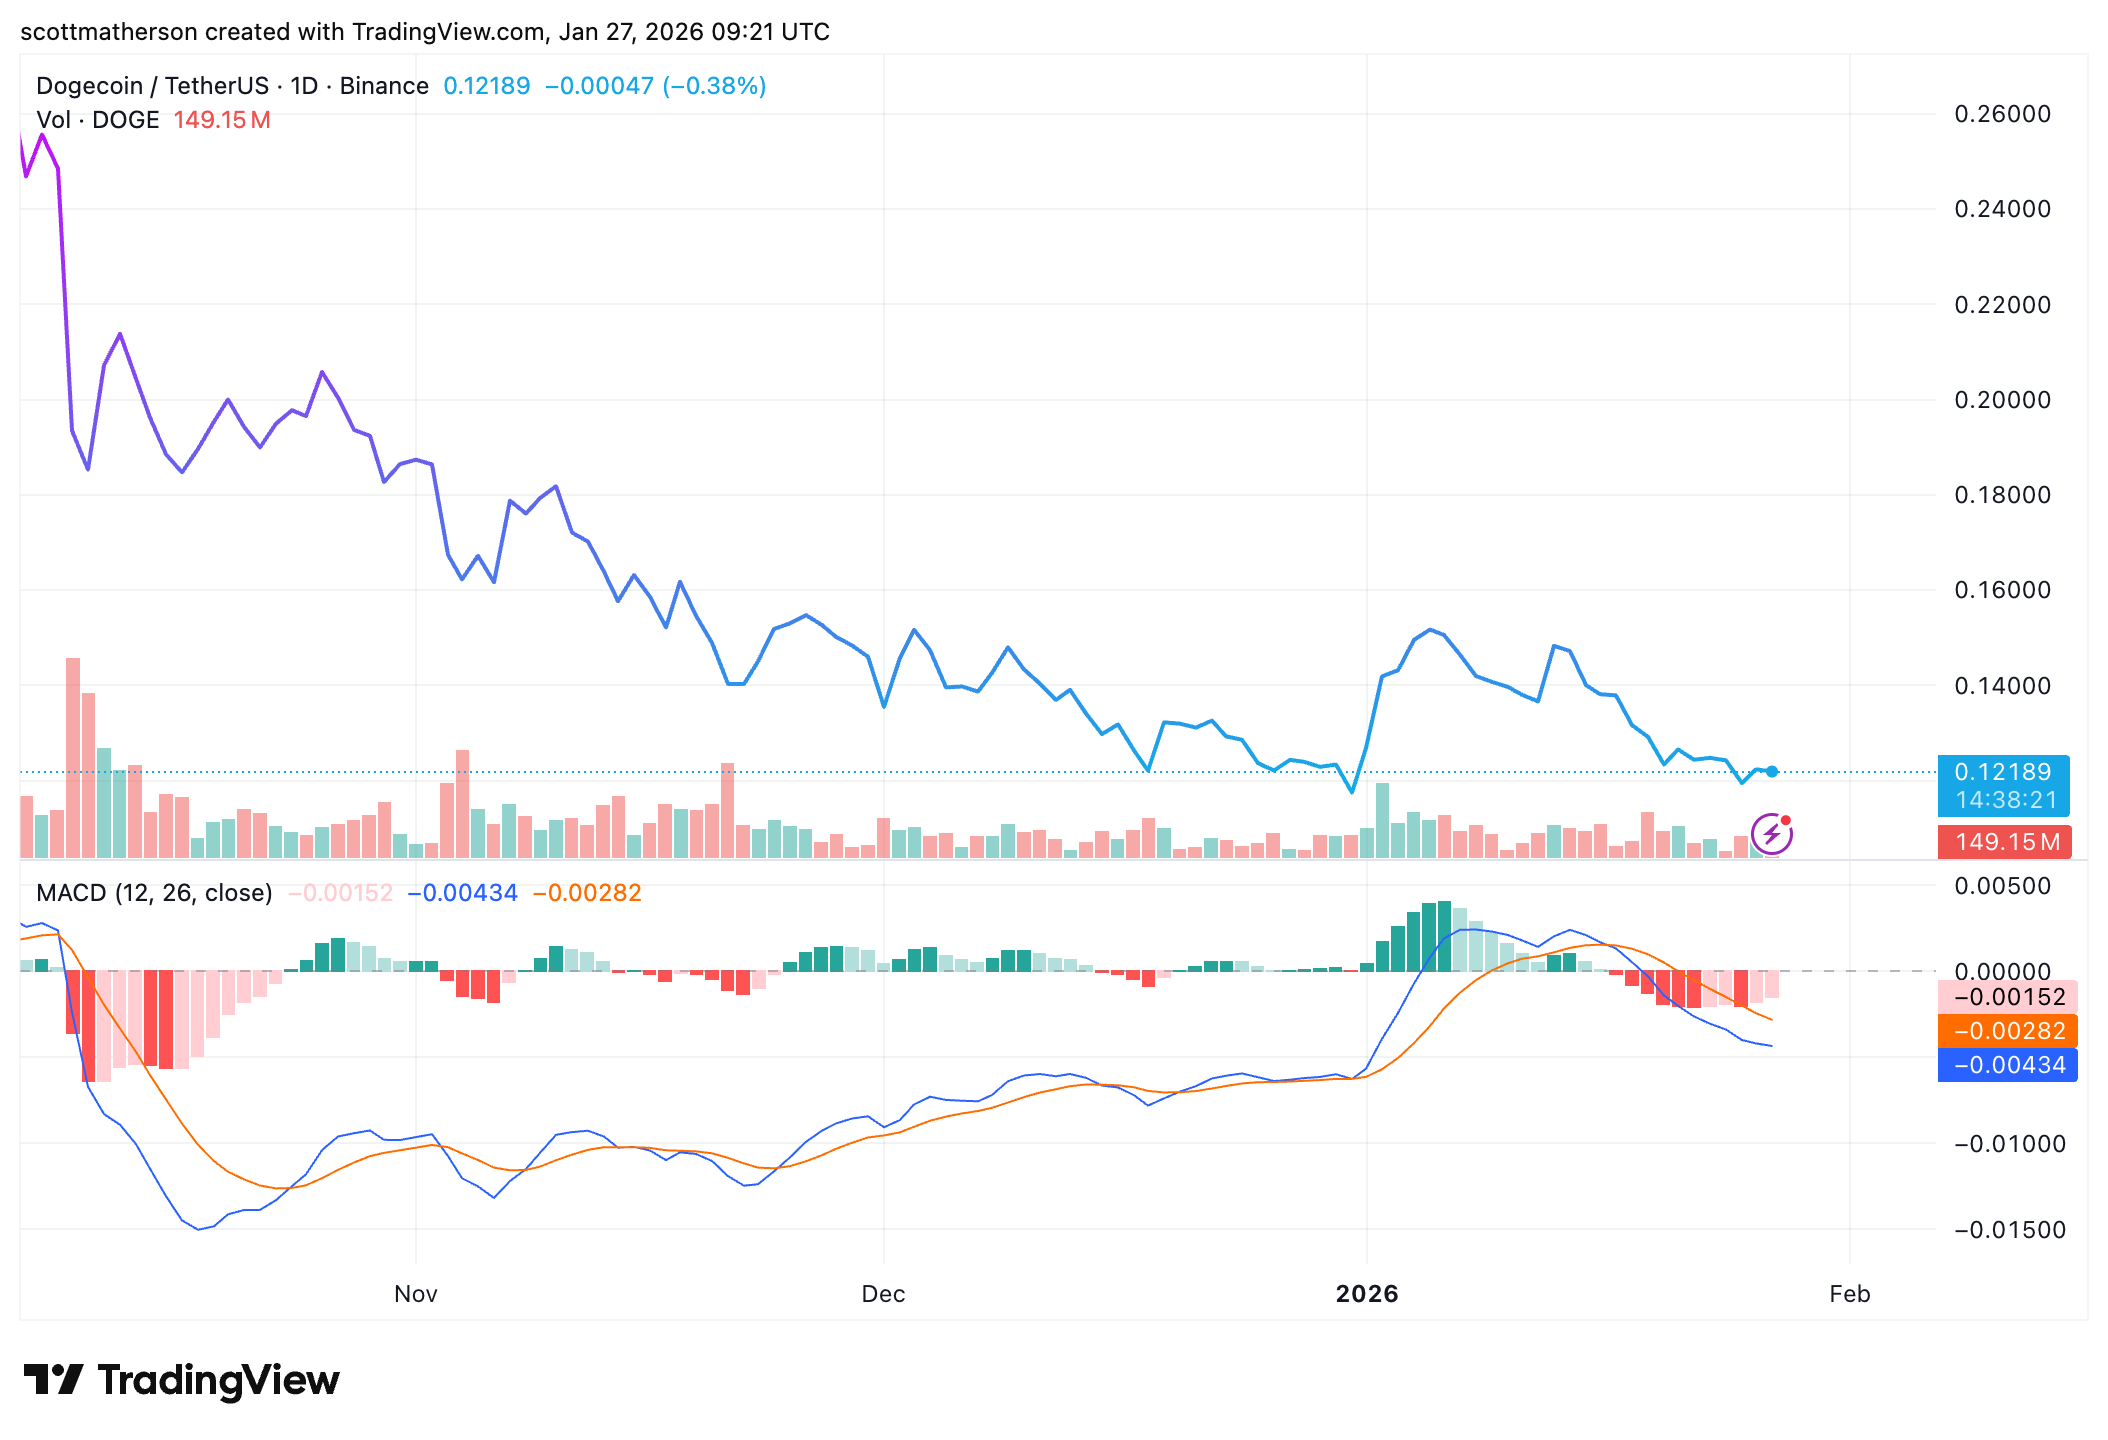
- Dogecoin is currently trading at $0.1221 and positioned at the base for a possible upward move.
These analyses indicate that Dogecoin may be transitioning out of its corrective phase towards a larger movement.