Jan 12, 2026
1 0
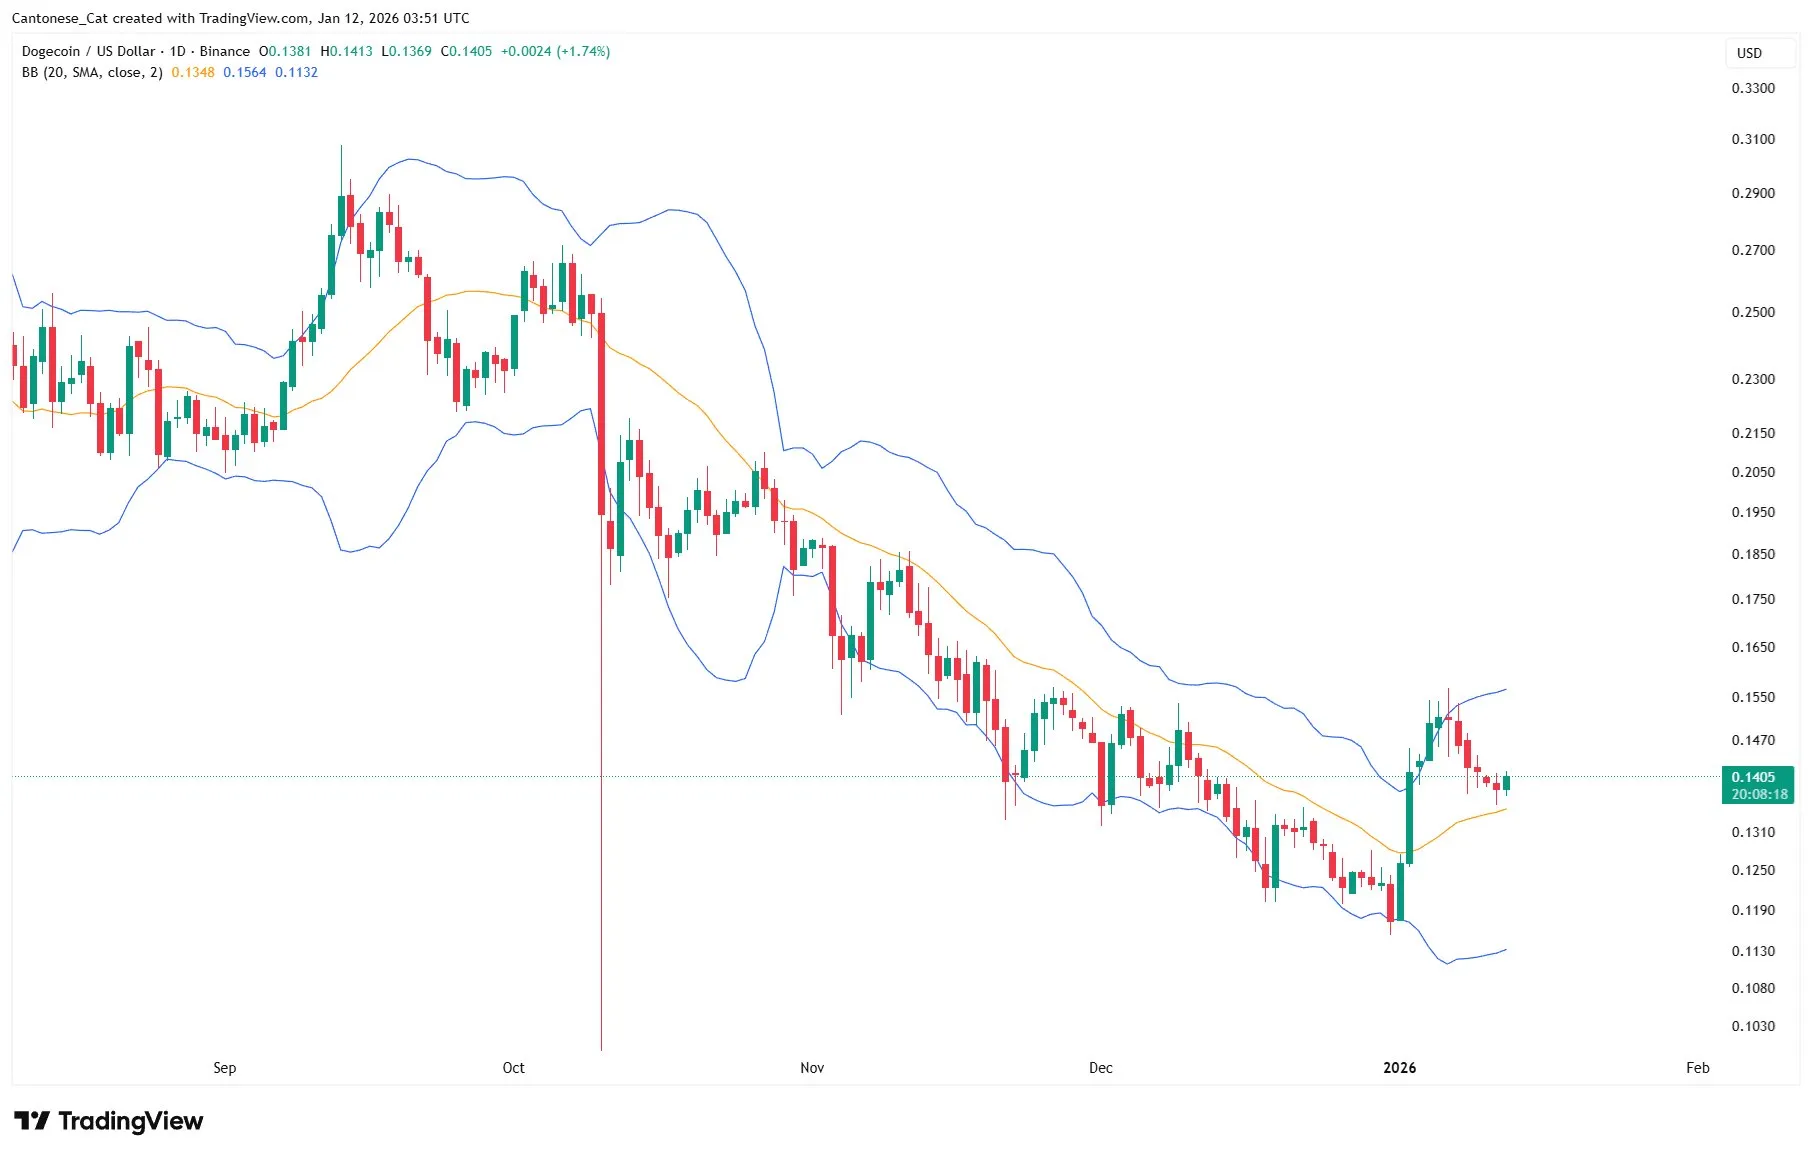
Dogecoin Surges 17% Indicating Potential Trend Shift
The price of Dogecoin has increased by about 17% since December 31, indicating a potential trend change. Analyst Cantonese Cat highlights DOGE's shift within its Bollinger Bands on the daily chart, moving from lower-band pressure to the upper range.
- DOGE is now trading above the 20-day basis line at $0.1348, with the current price around $0.13674.
- The upper Bollinger Band is near $0.1564, while the lower is close to $0.1132.
- The basis line acts as a crucial indicator for trend continuation or volatility expansion.
Weekly and Monthly Chart Analysis
- Cantonese Cat describes DOGE's broader structure as an Elliott Wave sequence—Wave 1 advance followed by Wave 2 correction.
- DOGE trades between the 0.382 retracement ($0.1177) and the 0.5 level ($0.1542).
- Higher retracements are marked at $0.2021 (0.618), continuing up to $8.9077 (2.272).
- DOGE's monthly chart compared to iShares Russell 2000 ETF shows possible delayed bullish patterns.
Key levels to watch include maintaining closure above the Bollinger basis (~$0.1348) and breaking past the upper band (~$0.1564) and 0.5 Fib level ($0.1542) for continued upward movement.