Apr 4, 2025
2 0
Dogecoin Tests Multi-Year Trend Line Amid Risk of Further Decline
Dogecoin is testing a crucial multi-year trend line, reflecting its performance since 2021. The current price is near a critical juncture that may lead to either a significant drop or a rebound.
Current Situation Overview
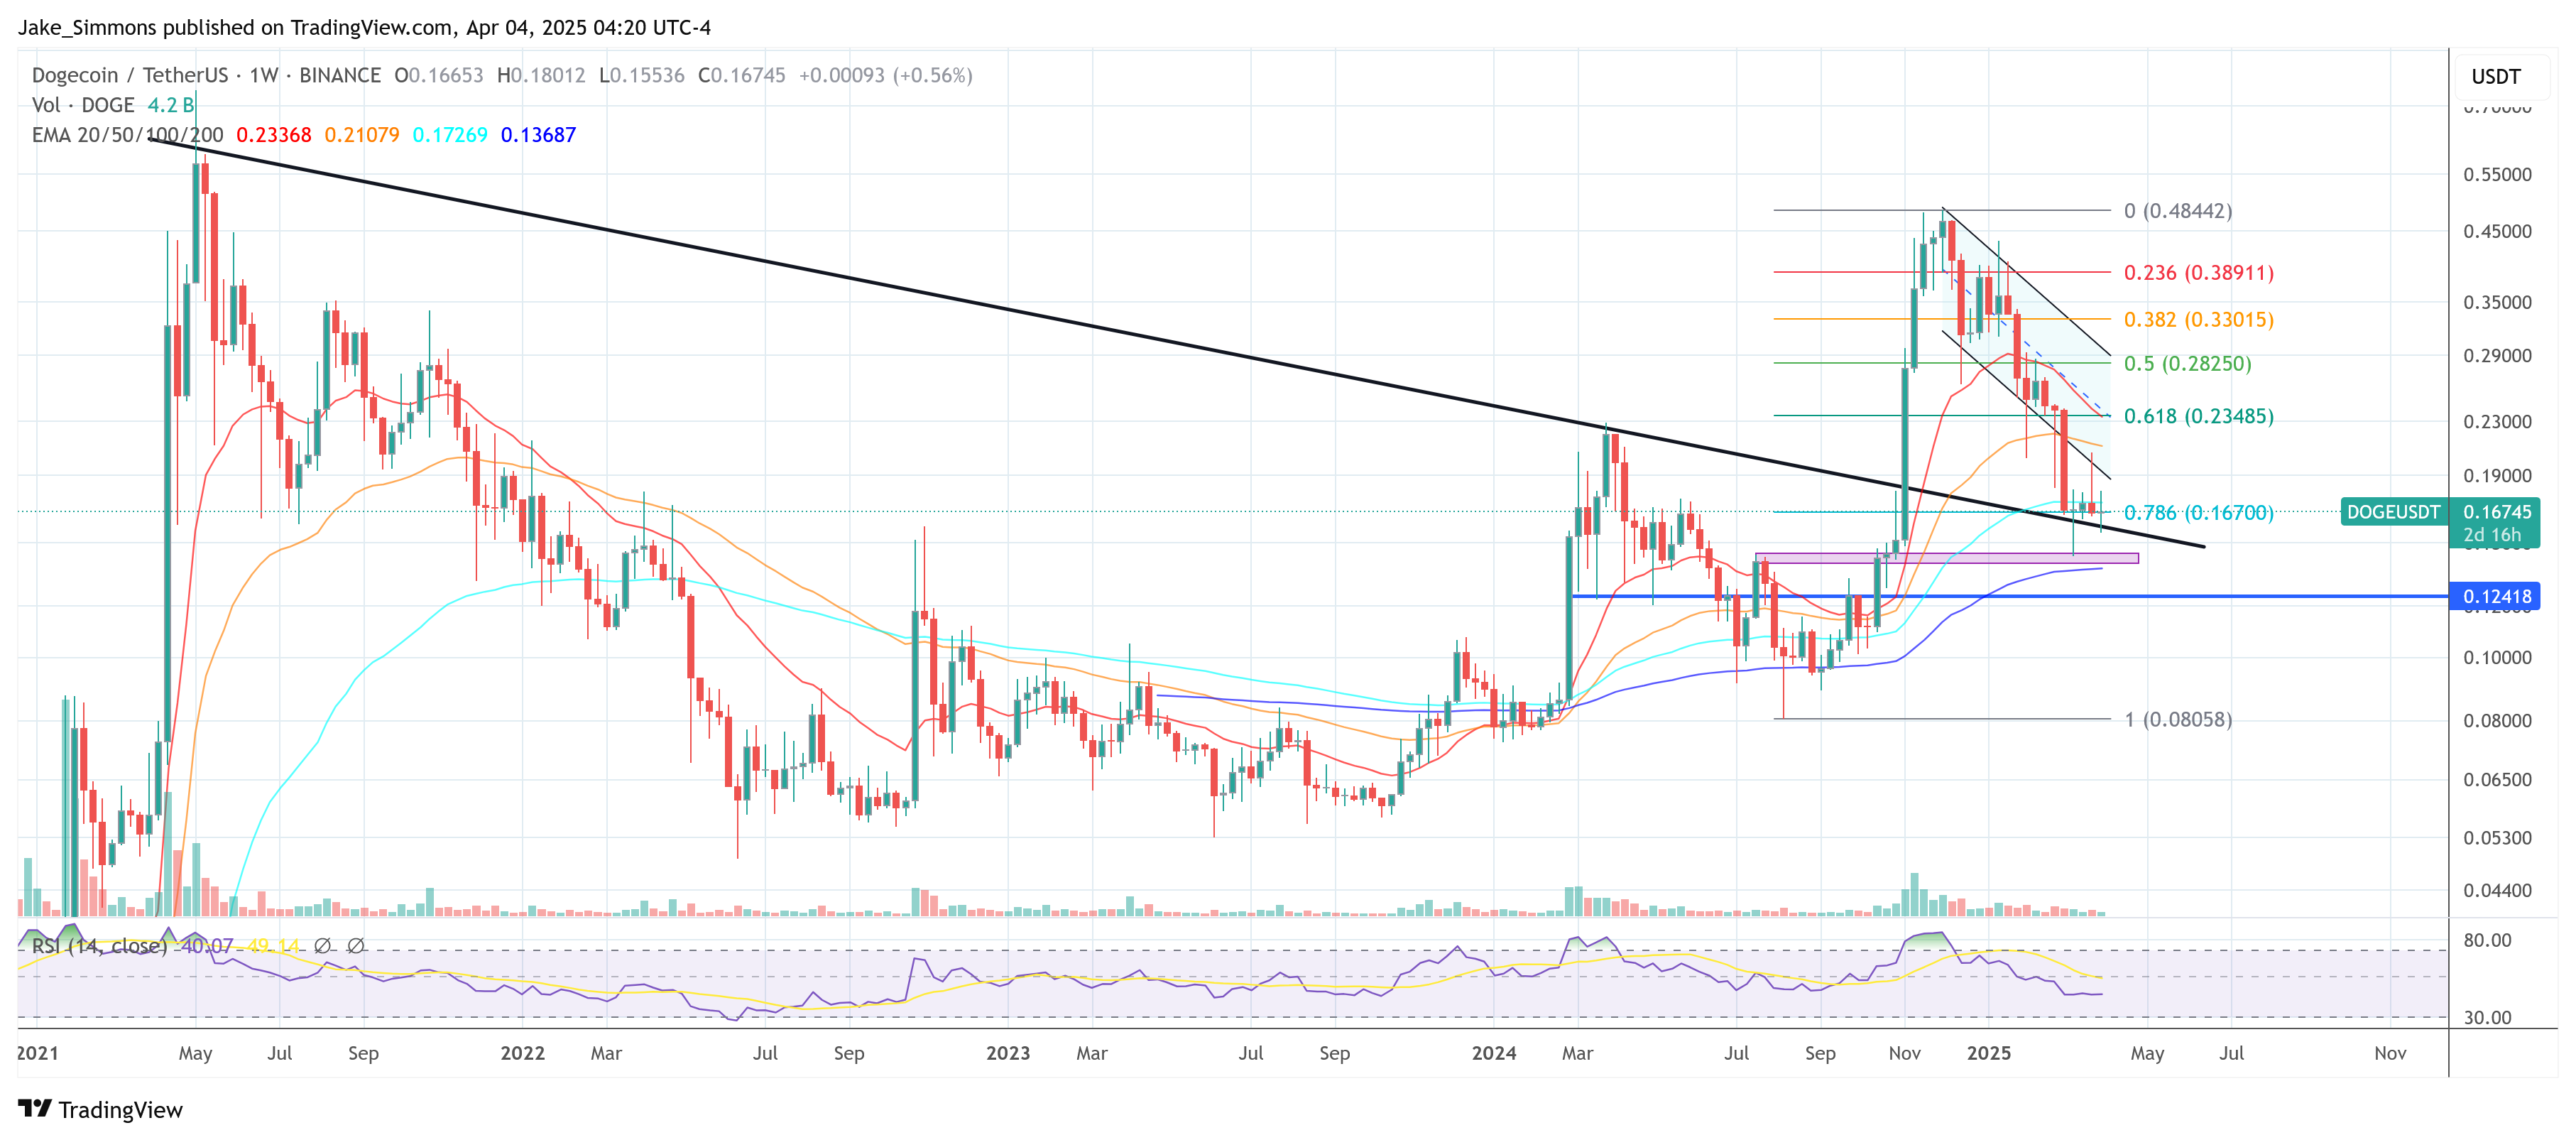
- Trend line aligns with the 0.786 Fibonacci retracement at approximately $0.167.
- Dogecoin is currently below this Fibonacci level but above the trend line at around $0.157.
- Currently down about 66% from a peak of over $0.48 in December.
- Failure to hold the trend line could result in a sell-off erasing up to 25% of its value.
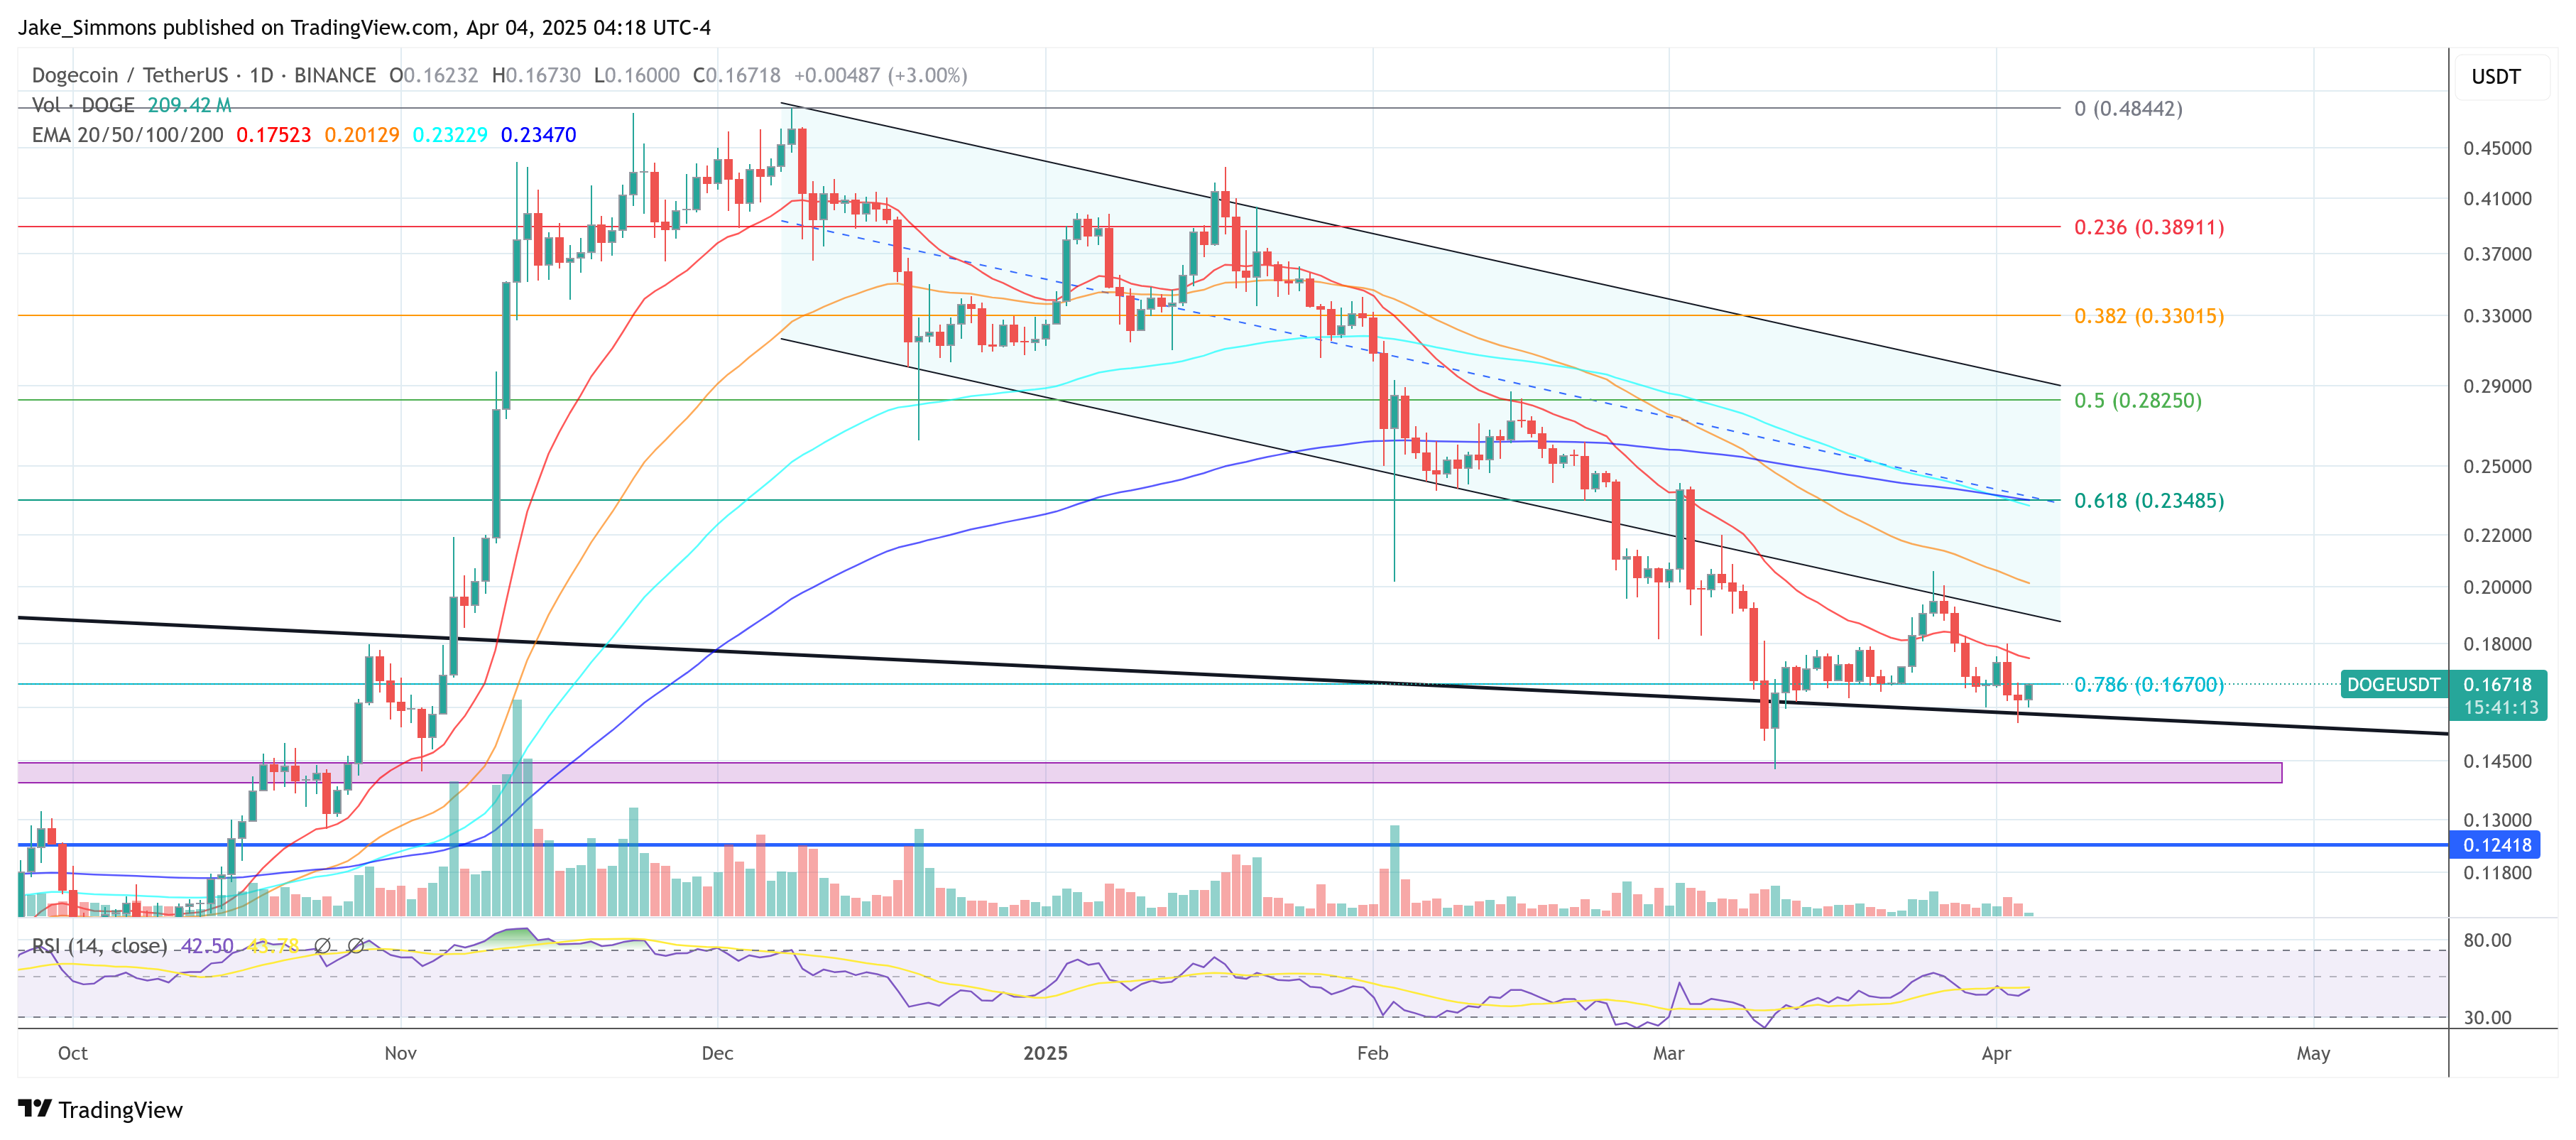
The daily chart shows Dogecoin's struggle to re-enter a downtrend channel after several failed attempts on March 2 and 3. Continuous rejections indicate bearish control and decreasing buying momentum.
- Weekly EMAs are positioned above the current price, acting as resistance.
- If Dogecoin falls below the trend line, it may test support around $0.14, with further declines potentially reaching $0.12.
Dogecoin's future depends on maintaining structural support at the trend line. A strong defense here could lead to a possible recovery; otherwise, a break below $0.14 raises the likelihood of further losses.