Oct 15, 2025
7 0
Dogecoin’s 36,000% Surge Pattern Resurfaces Amid Recent Price Decline
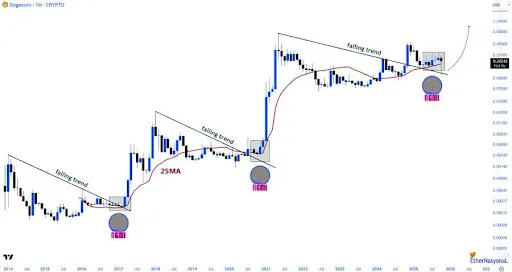
Dogecoin experienced a sharp decline over the weekend, dropping below $0.20 and reversing weeks of gains. Despite this, the monthly chart remains bullish, trading above the 25-month moving average.
- Technical analyst EᴛʜᴇʀNᴀꜱʏᴏɴᴀL notes a pattern similar to the 36,000% rally in 2021 has reappeared.
- The setup involves a breakout from a falling trend, trading above the 25MA, and a successful retest phase.
- The current consolidation mirrors previous periods that led to major parabolic runs in 2017 and 2021.
The analyst highlights Dogecoin's historical "NGMI" phase, where slight dips or sideways trading occur after breaking out of a downtrend.
Currently, Dogecoin trades around the downward trendline it broke in late 2024. A recent fall to $0.18 briefly touched this line again.
- If the pattern holds, the present downtrend could lead to another strong rally.
- The alignment of price stability above the 25MA, a long-term downtrend breakout, and retest confirmation indicates building momentum.
At the time of writing, Dogecoin is priced at $0.201, reflecting a 5.2% decrease over 24 hours and a 23% drop over seven days.