ETH and SOL Lag Behind BTC in Price Recovery
This is a segment from the Empire newsletter. To read full editions, subscribe.
Identifying the End of a Bull Run
Bitcoin is nearing its price record from March. If it continues to rise, it will eventually hit a local peak, prompting speculation about the end of the current bull run.
Historical analysis provides insights, though it may not offer precise predictions. Ethereum (ETH) has underperformed compared to Bitcoin (BTC) this year, which fuels discussions on its potential decline against competitors like Solana (SOL). Historically, ETH has lagged BTC in reaching new price records.

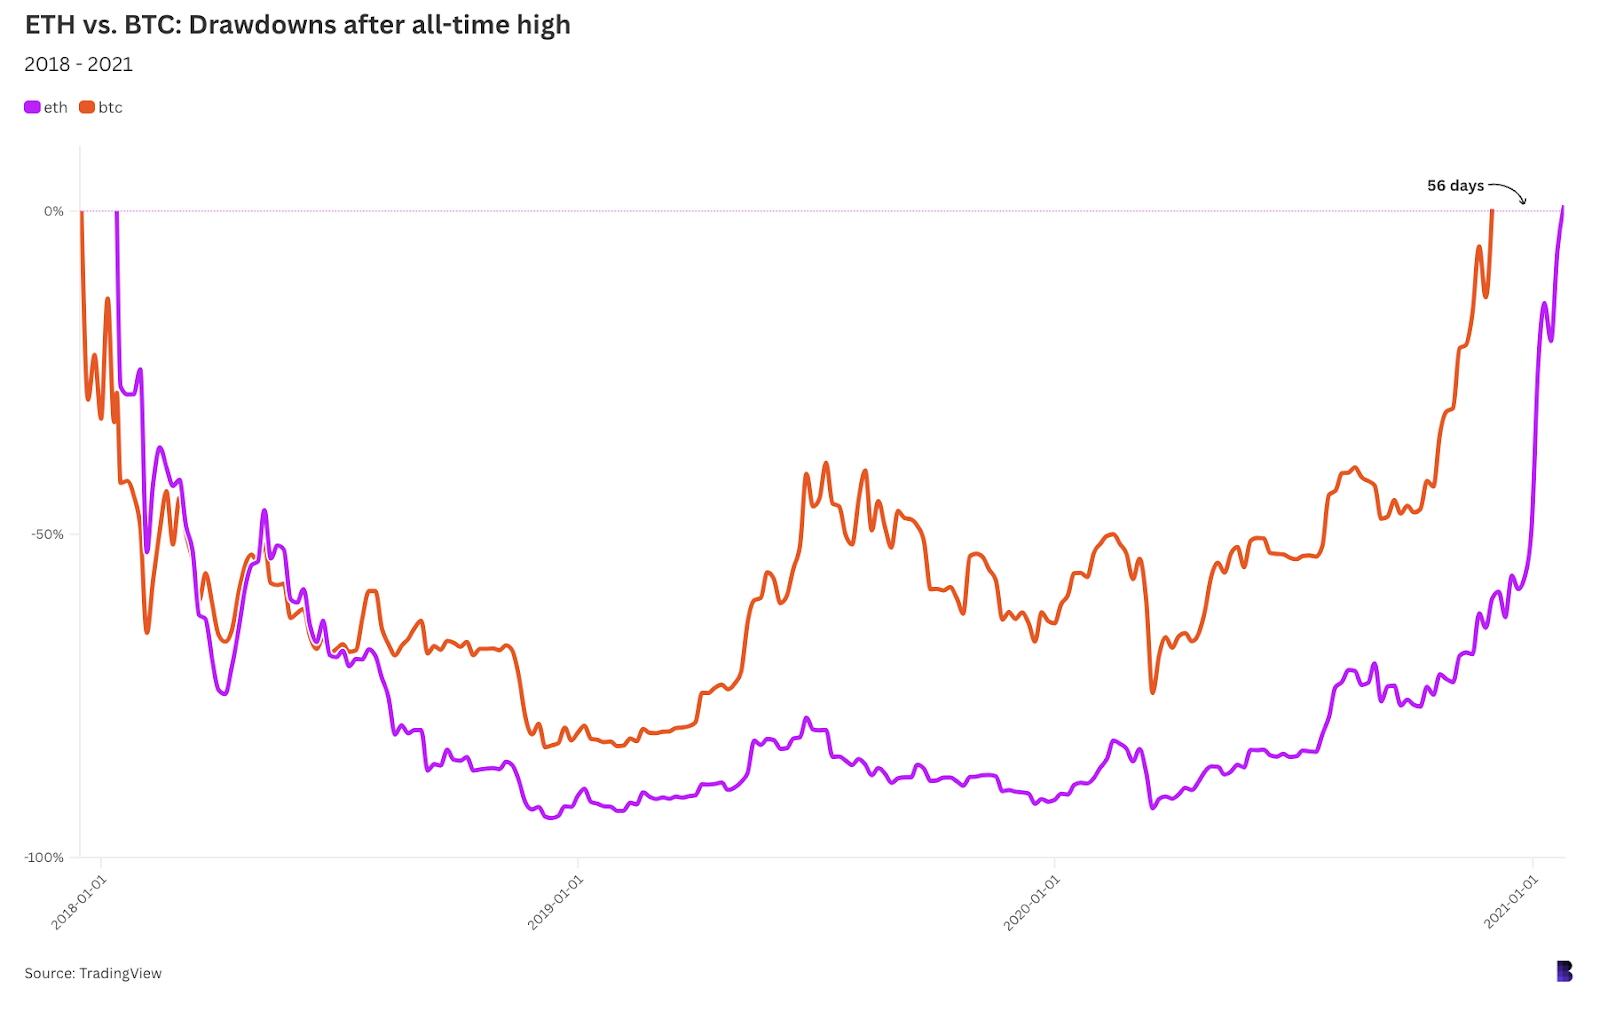
ETH reached its all-time high on January 13, 2018, 27 days after BTC peaked at nearly $20,000. BTC took 1,080 days to surpass that level in December 2020, while ETH remained 60% below its peak but subsequently doubled within 56 days.
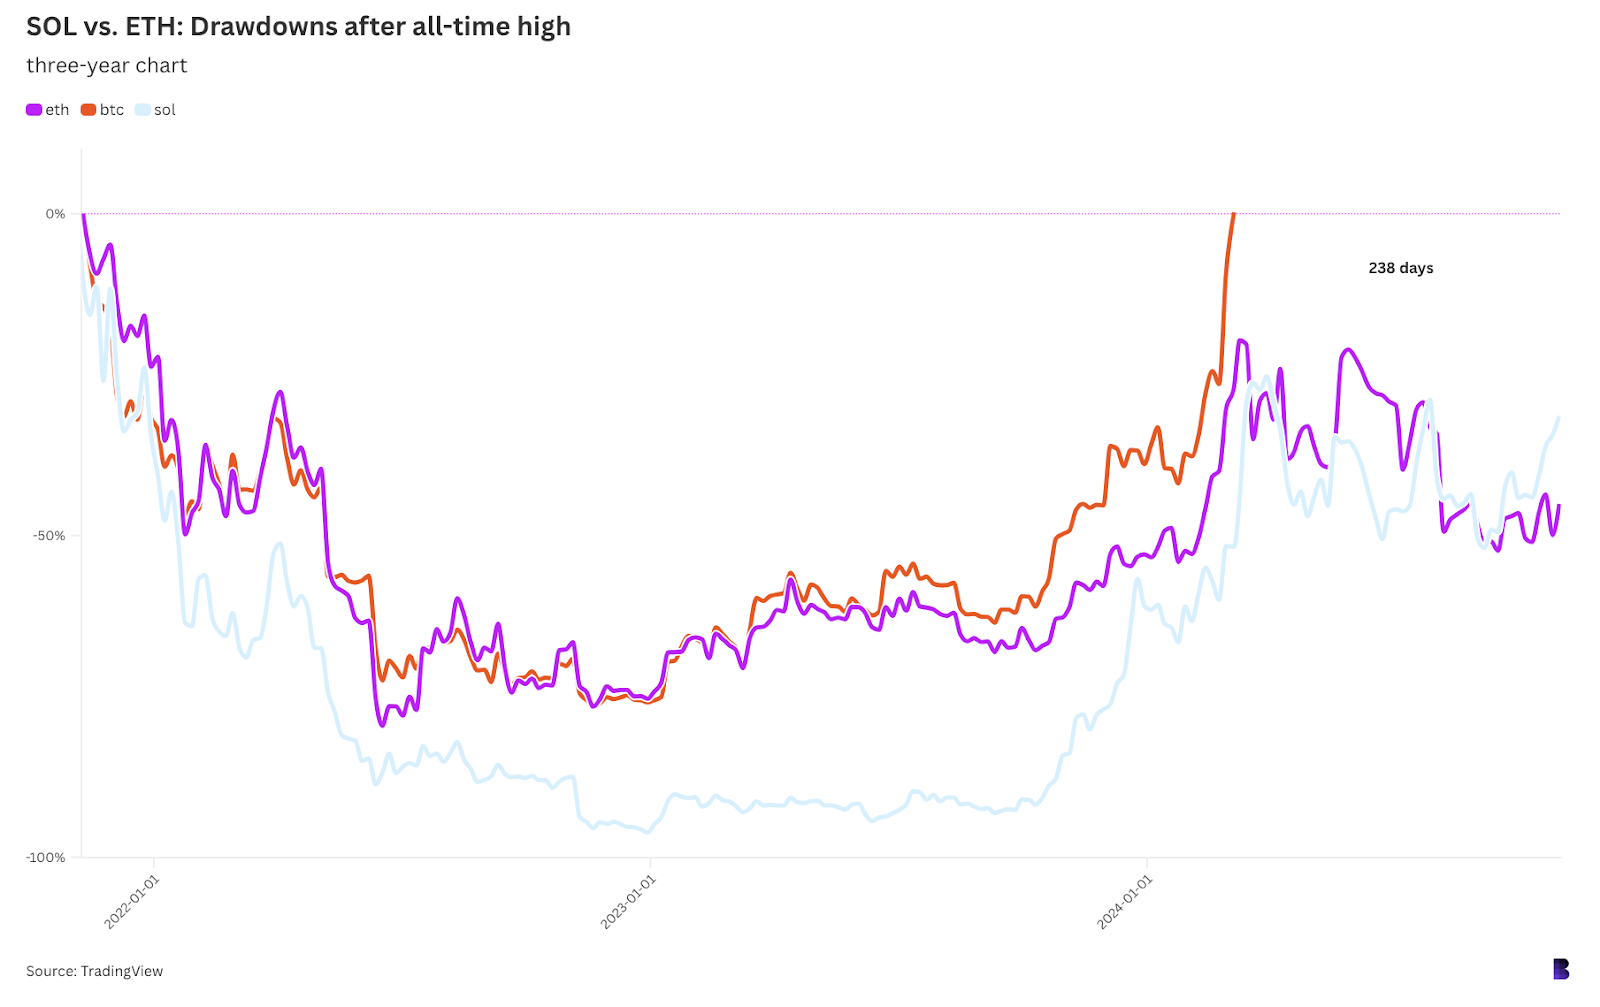
Currently, it has been 238 days since BTC broke its previous high from November 2021, while ETH is 45% below its peak and hasn’t been within 20% of its record.
SOL has performed similarly to ETH during this period, remaining 31% below its November 2021 record high.

The correlation between ETH and SOL has tightened since bitcoin’s March peak. The future performance of ETH and SOL in relation to BTC’s bull run remains uncertain.
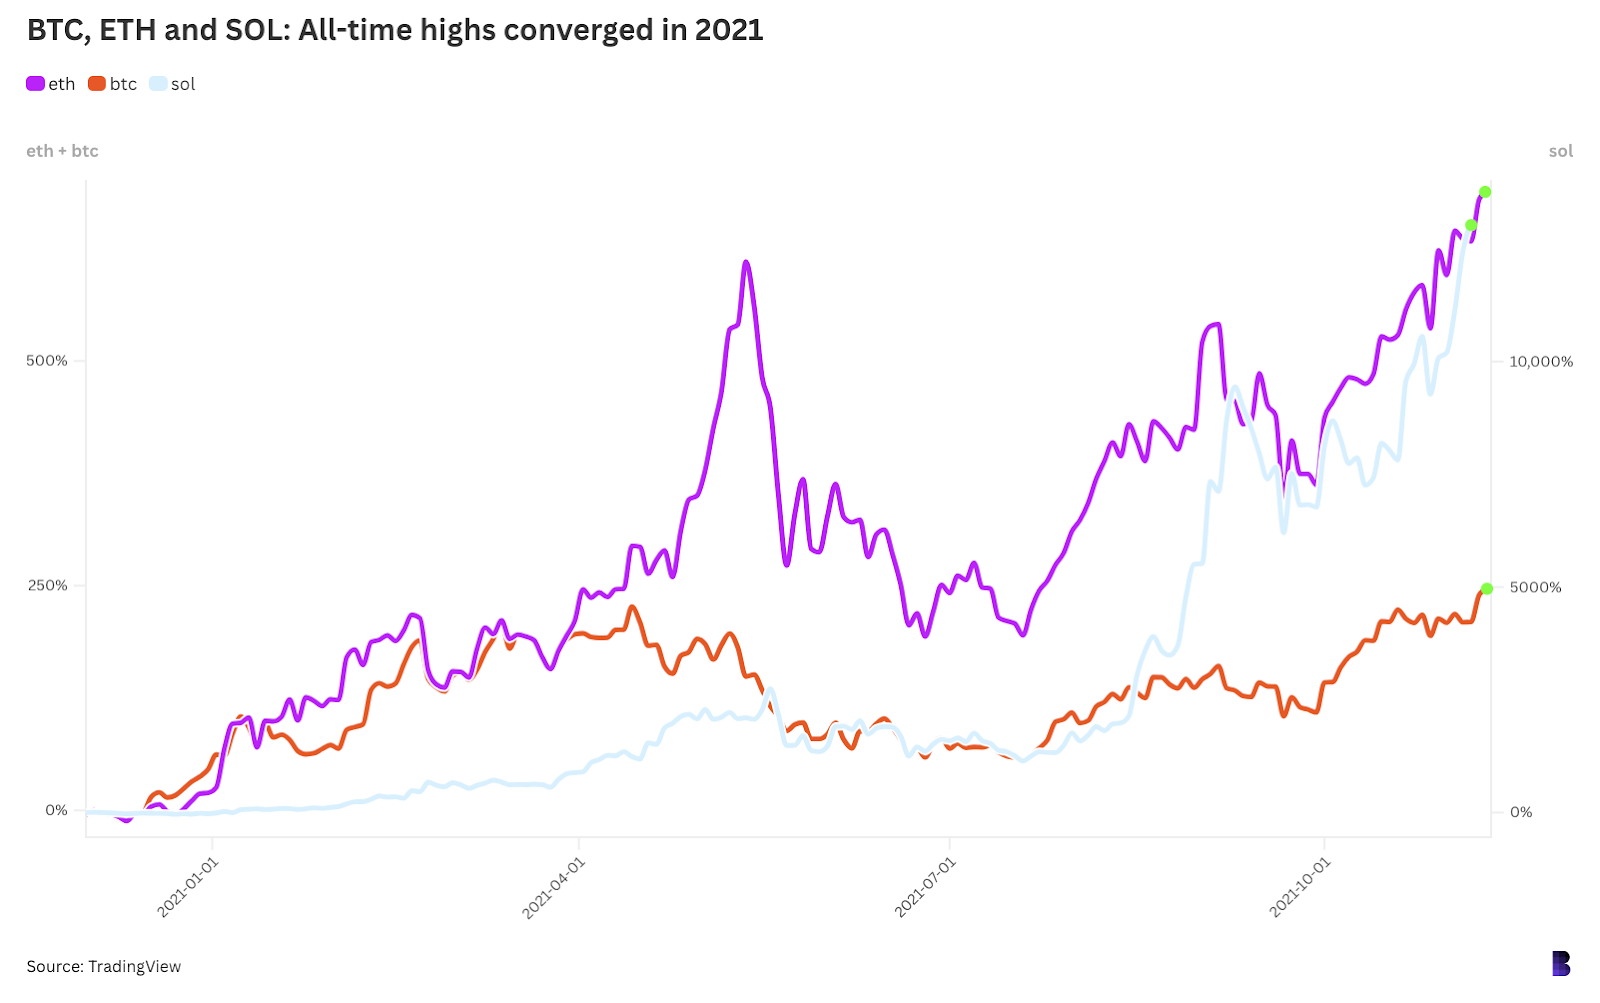
A key indicator of the end of a bull run is when major assets converge at their all-time highs.

During past cycle tops, BTC and ETH did not recover simultaneously. However, they aligned closely when achieving new peaks almost a year later, with both hitting all-time highs on the same day, while SOL peaked a few days earlier.