Feb 2, 2026
8 0
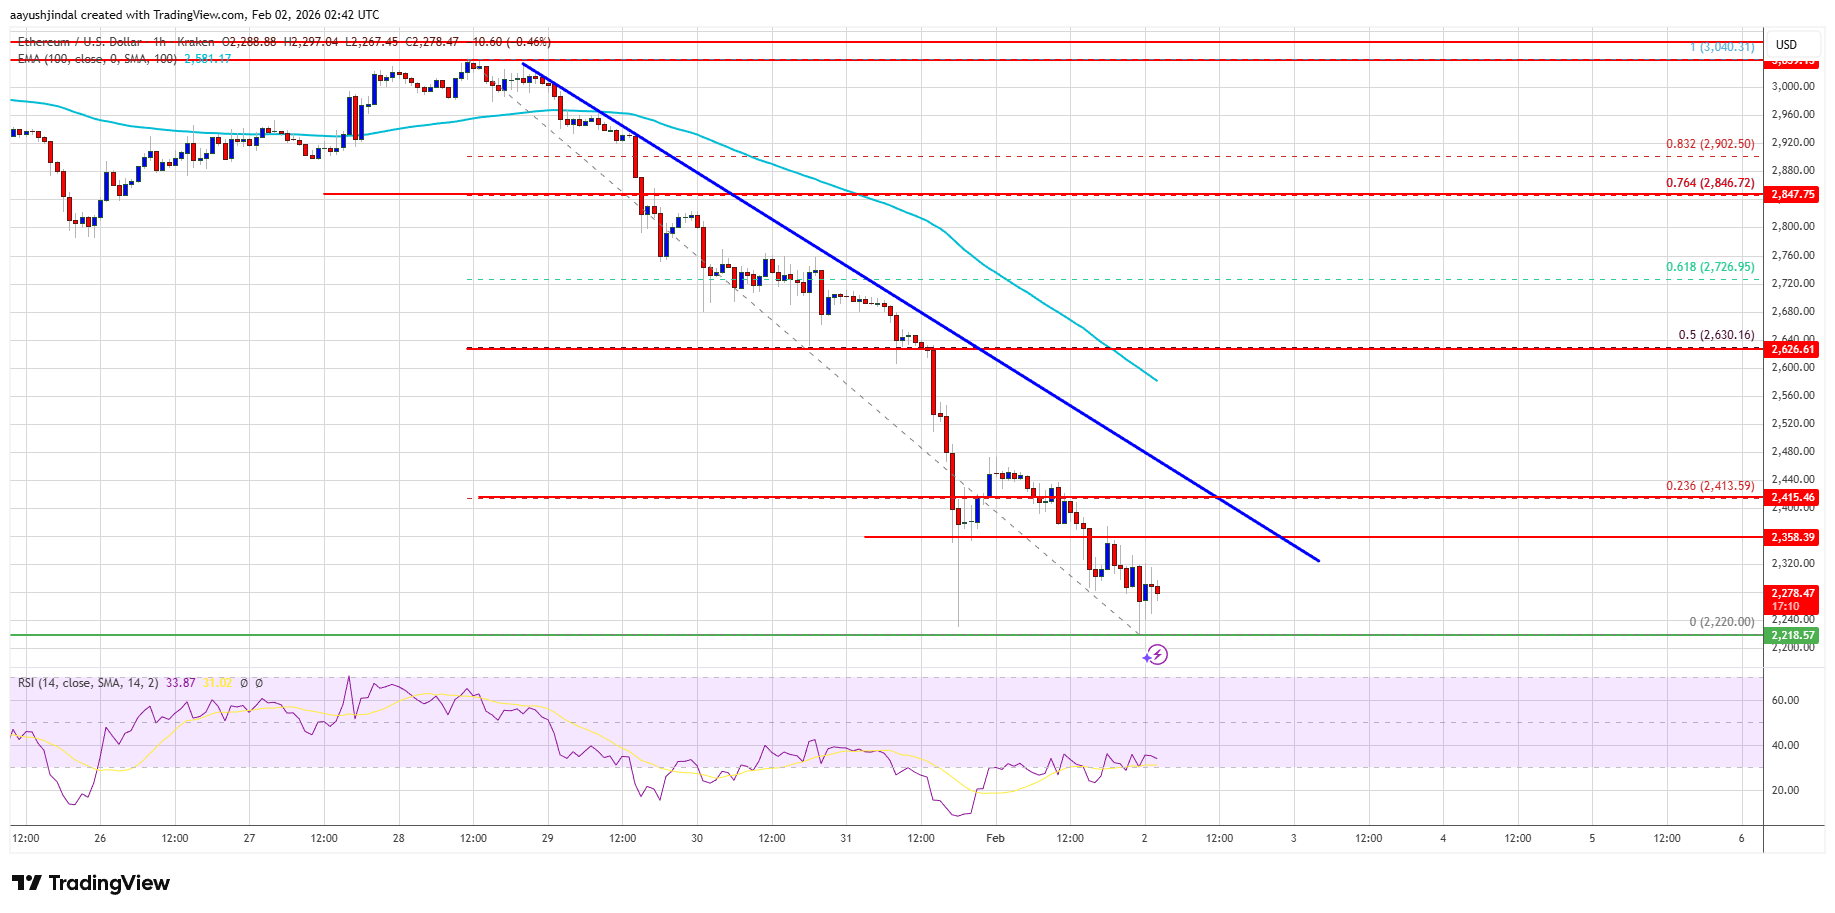
BEARISH 📉 : Ethereum drops 20%, struggles to hold $2,200 support level
Ethereum Price Decline
- Ethereum's price declined by 20% after failing to hold above $2,550.
- The price is currently below $2,400 and the 100-hourly Simple Moving Average.
- A bearish trend line forms resistance at $2,415 on the ETH/USD hourly chart (Kraken data).
- If Ethereum remains above the $2,200 zone, a fresh increase could occur.
Technical Overview
- ETH traded below $2,250, forming a low at $2,220.
- The current trading range is below the 23.6% Fib retracement level from a $3,040 high to a $2,220 low.
- Immediate resistance levels are at $2,350, $2,420, and potentially $2,500.
- An upside breakout above $2,620 could lead to further gains toward $2,800 or even $2,880.
Potential for Further Losses
- If Ethereum fails to surpass $2,420, a new decline may begin.
- Initial support is near $2,220, with major support at $2,200.
- A drop below $2,200 could lead to further declines toward $2,120 or $2,050.
- Main support is at $2,000.
Technical Indicators
- Hourly MACD: Bearish momentum.
- Hourly RSI: Below 50.
- Major Support Level: $2,200.
- Major Resistance Level: $2,420.