Dec 30, 2025
12 3
Ethereum Faces Potential Decline Below Key Support Levels
Ethereum Price Overview
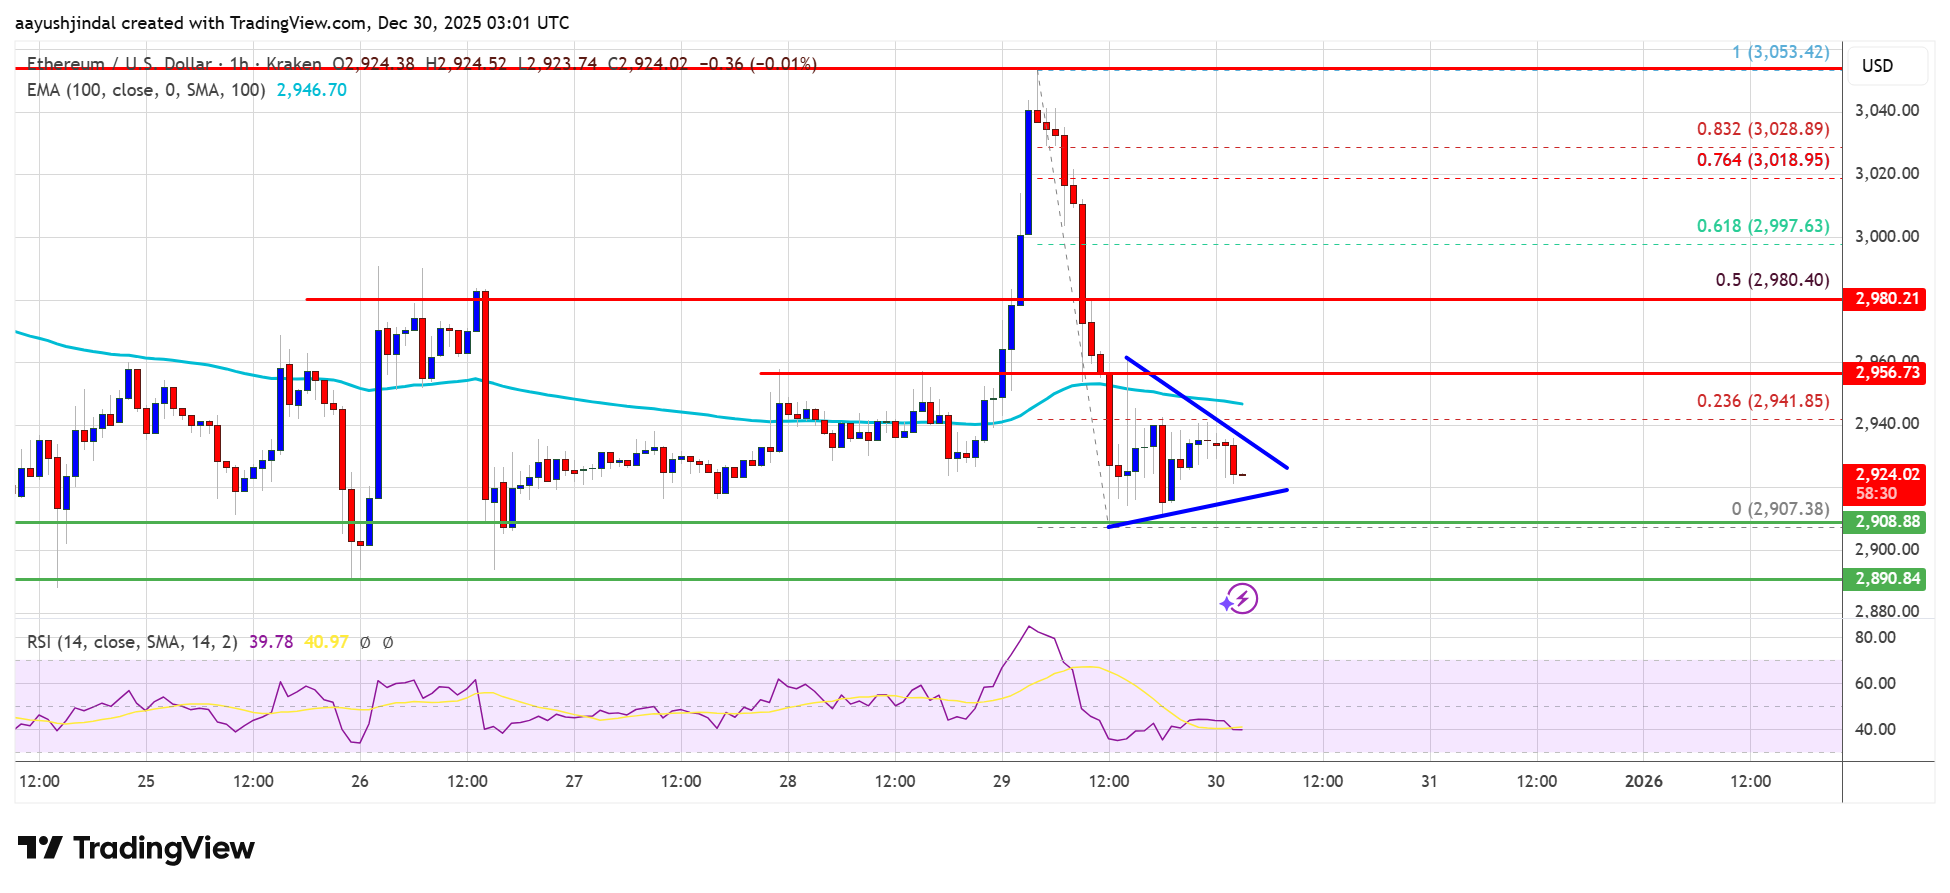
- Ethereum attempted a recovery but faced resistance above $3,000, leading to a decline.
- Current trading is below $2,950 and the 100-hourly Simple Moving Average.
- A contracting triangle with resistance at $2,930 is forming on the hourly chart of ETH/USD.
- If Ethereum breaks below the $2,880 zone, further downward movement is possible.
Price Movements
- The price initially climbed above $3,000, reaching a high of $3,053 before declining.
- Sharp declines brought the price below $3,000 and eventually to a low of $2,907.
- The price is now consolidating below the 23.6% Fib retracement level from $3,053 to $2,907.
- Resistance levels to watch are at $2,940, $2,955, and $2,980.
- An upside break above $2,950 could lead to testing the $3,000 and $3,050 zones.
Potential Downside
- If unable to surpass $2,955, Ethereum may start another decline.
- Initial support is around $2,900, with significant support at $2,880.
- Further declines could target supports at $2,840 and $2,800, with key support at $2,720.
Technical Indicators
- Hourly MACD indicates bearish momentum for ETH/USD.
- Hourly RSI is below 50, suggesting selling pressure.