Ethereum Price Approaches $3,500 as Monthly Inflows Exceed $2 Billion
Bitcoin approaches $97,000, while Ethereum (ETH) is on an upward trend, nearing the $3,500 mark with a 4.16% increase in the past 24 hours.
Ethereum is poised for a potential trend reversal, with predictions suggesting it may exceed $4,000 during the New Year rally.
Will ETH Prices Cross the $3,500 Supply Zone?
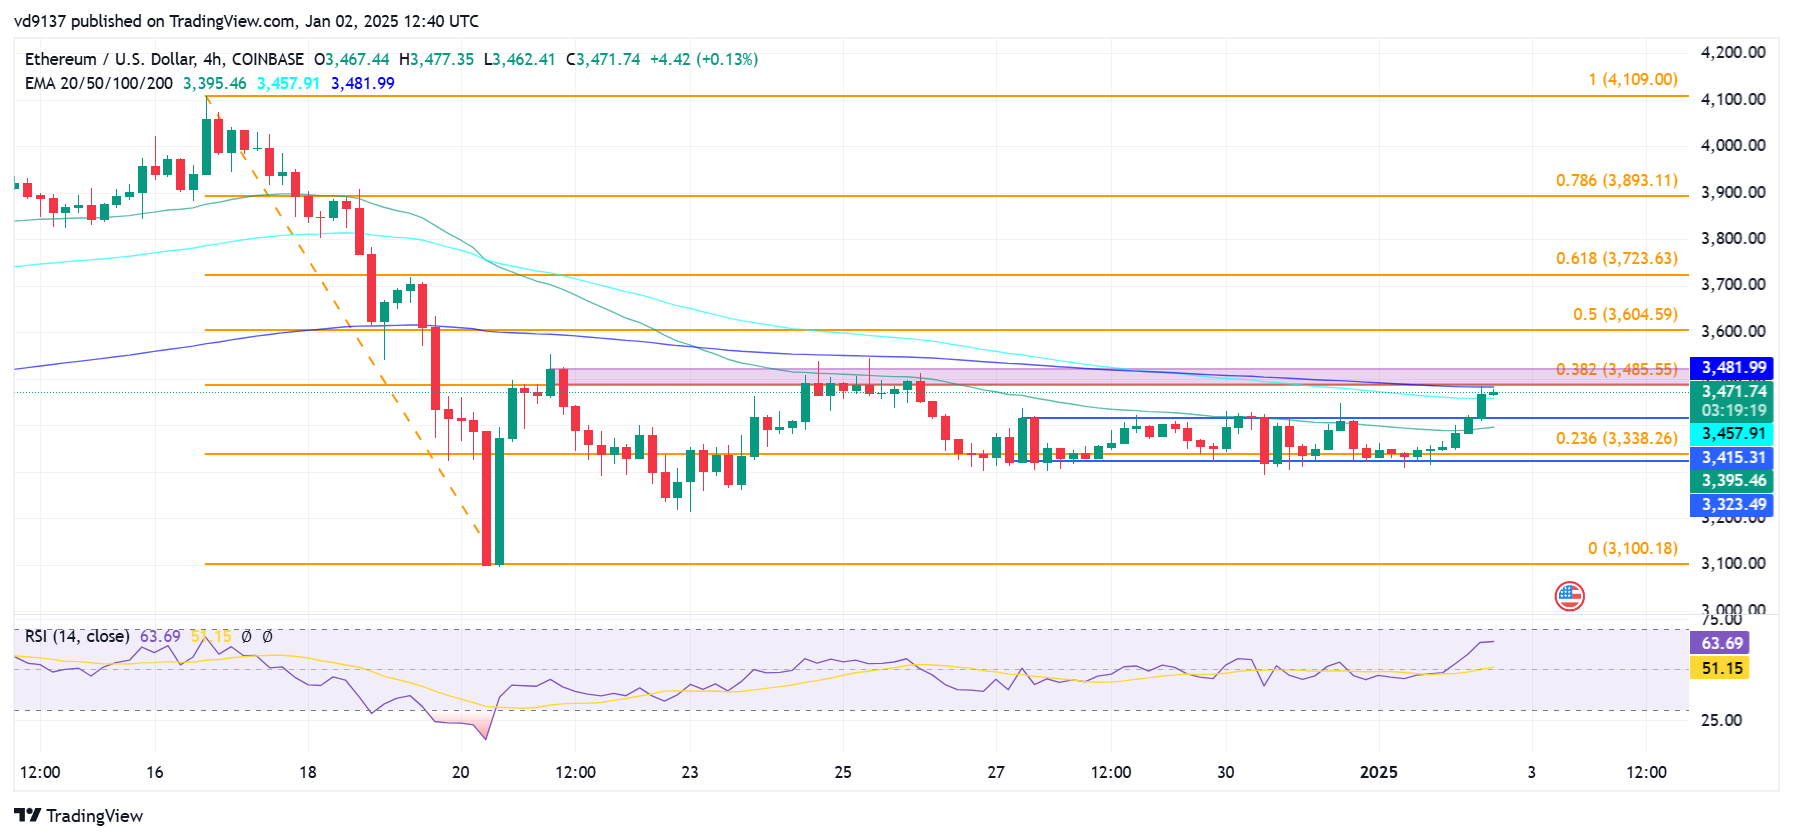
The 4-hour chart indicates Ethereum has broken out of a consolidation range between $3,323 and $3,415. This breakout resulted in seven consecutive bullish candles, marking a recovery from the 23.60% Fibonacci level to challenge the 38.20% level.

The 200 EMA line acts as dynamic resistance alongside the Fibonacci resistance at the $3,500 psychological mark, indicating a key supply zone. A bullish closure above $3,521 would signal a reversal.
The 4-hour RSI is nearing the overbought boundary, reflecting increased buying pressure. If Ethereum surpasses the immediate supply zone, it may reach the 78.60% Fibonacci level near $3,900, increasing the likelihood of crossing the $4,000 barrier in early January 2025. Conversely, failure to breach this zone will maintain the consolidation range, with support at the 23.60% Fibonacci level of $3,338.
Blackrock Hypes Institutional Support for Ethereum
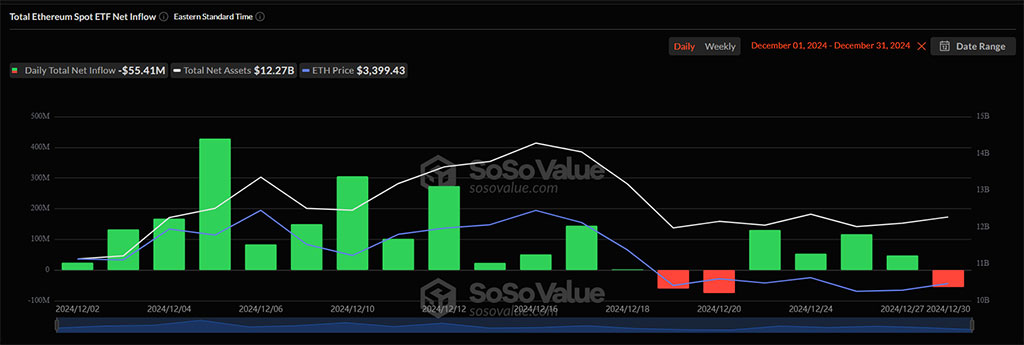
In December 2024, institutions capitalized on a 10.15% pullback in Ethereum prices, with nine Ethereum ETFs reporting over $2.08 billion in net inflows, nearly double November's figures. Blackrock's ETHA led with $1.4 billion in inflows over 13 consecutive days, followed by Fidelity’s FETH with $752 million. This surge reflects growing institutional demand for Ethereum.

Is Ethereum Flippening Possible?
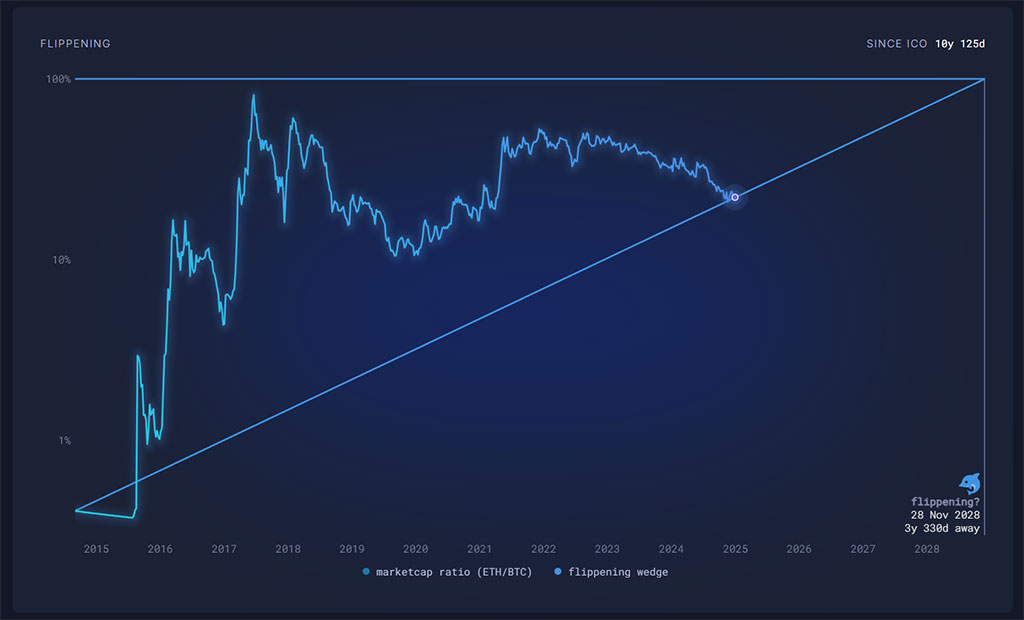
Ethereum flippening refers to the scenario where Ethereum's market capitalization exceeds that of Bitcoin. Currently, Bitcoin's market cap is approximately $2 trillion, compared to Ethereum's $418 billion, indicating a significant gap. The chances of flippening have declined since the 2017 bull run.

Flippening probabilities peaked at 81.5% on June 19, 2017, and nearly 50% during the 2021 bull run. Following price pullbacks and Bitcoin's growth due to ETF listings, the chances have decreased to 22.22%. While projected three years and 327 days away, current trends indicate Ethereum's underperformance relative to Bitcoin.
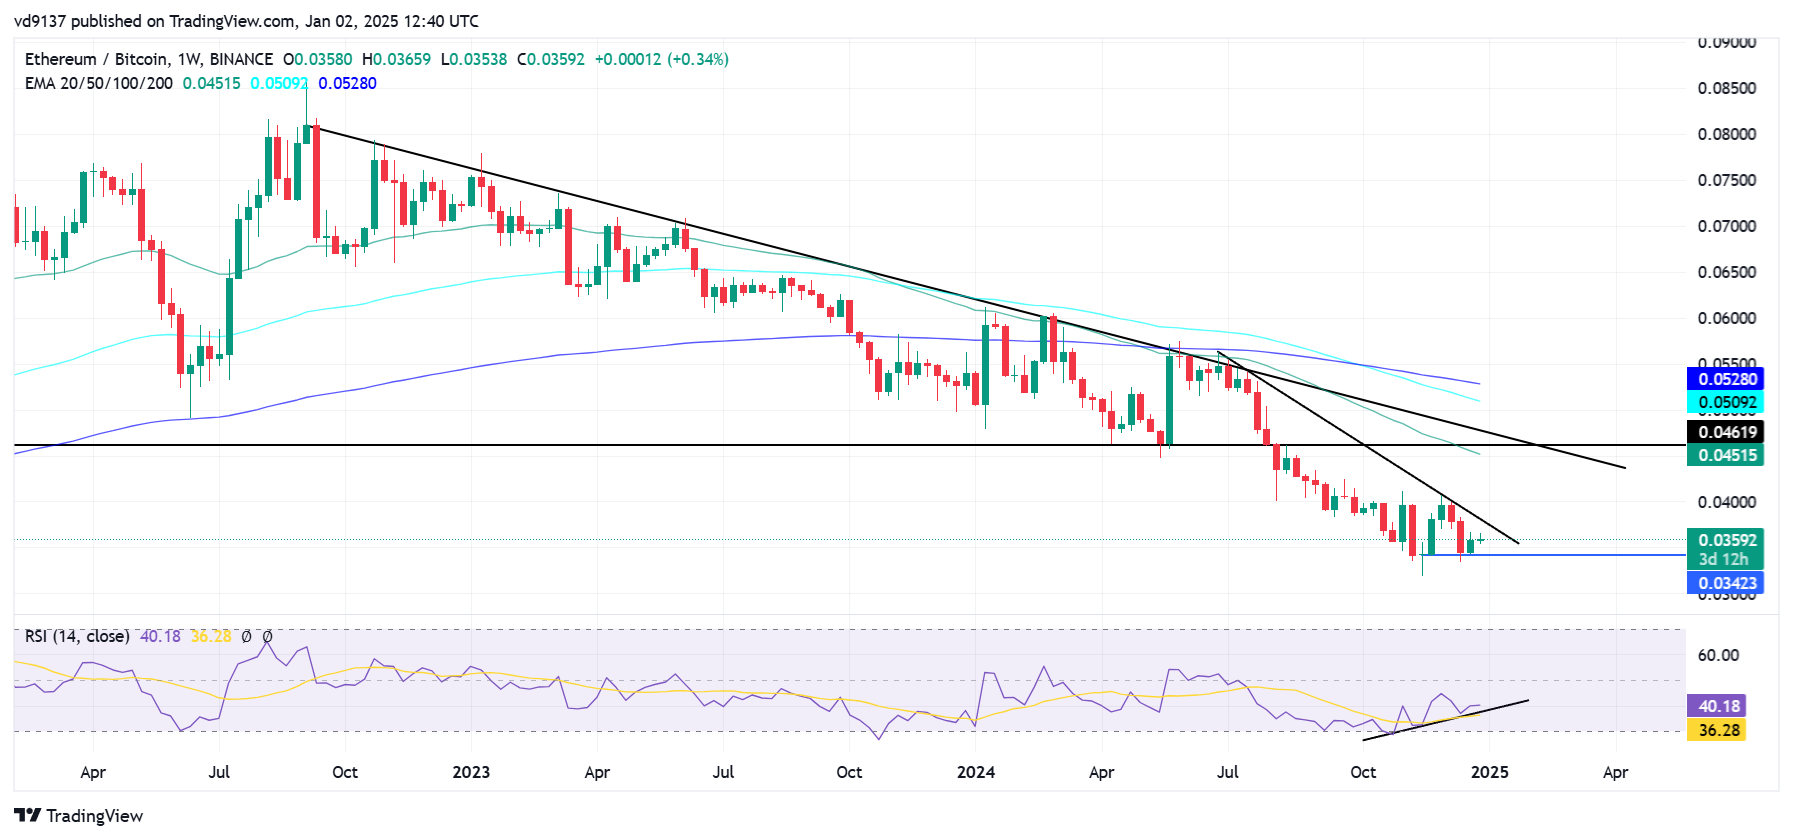
The Ethereum to BTC chart suggests a potential bullish comeback despite a 7.13% decline against Bitcoin in December. The weekly chart shows signs of a possible double-bottom reversal supported by a bullish divergence in the weekly RSI.

If Ethereum outperforms multiple tokens, breaking short-term resistance could challenge a long-standing resistance near 0.04619 BTC.