Feb 16, 2026
23 3
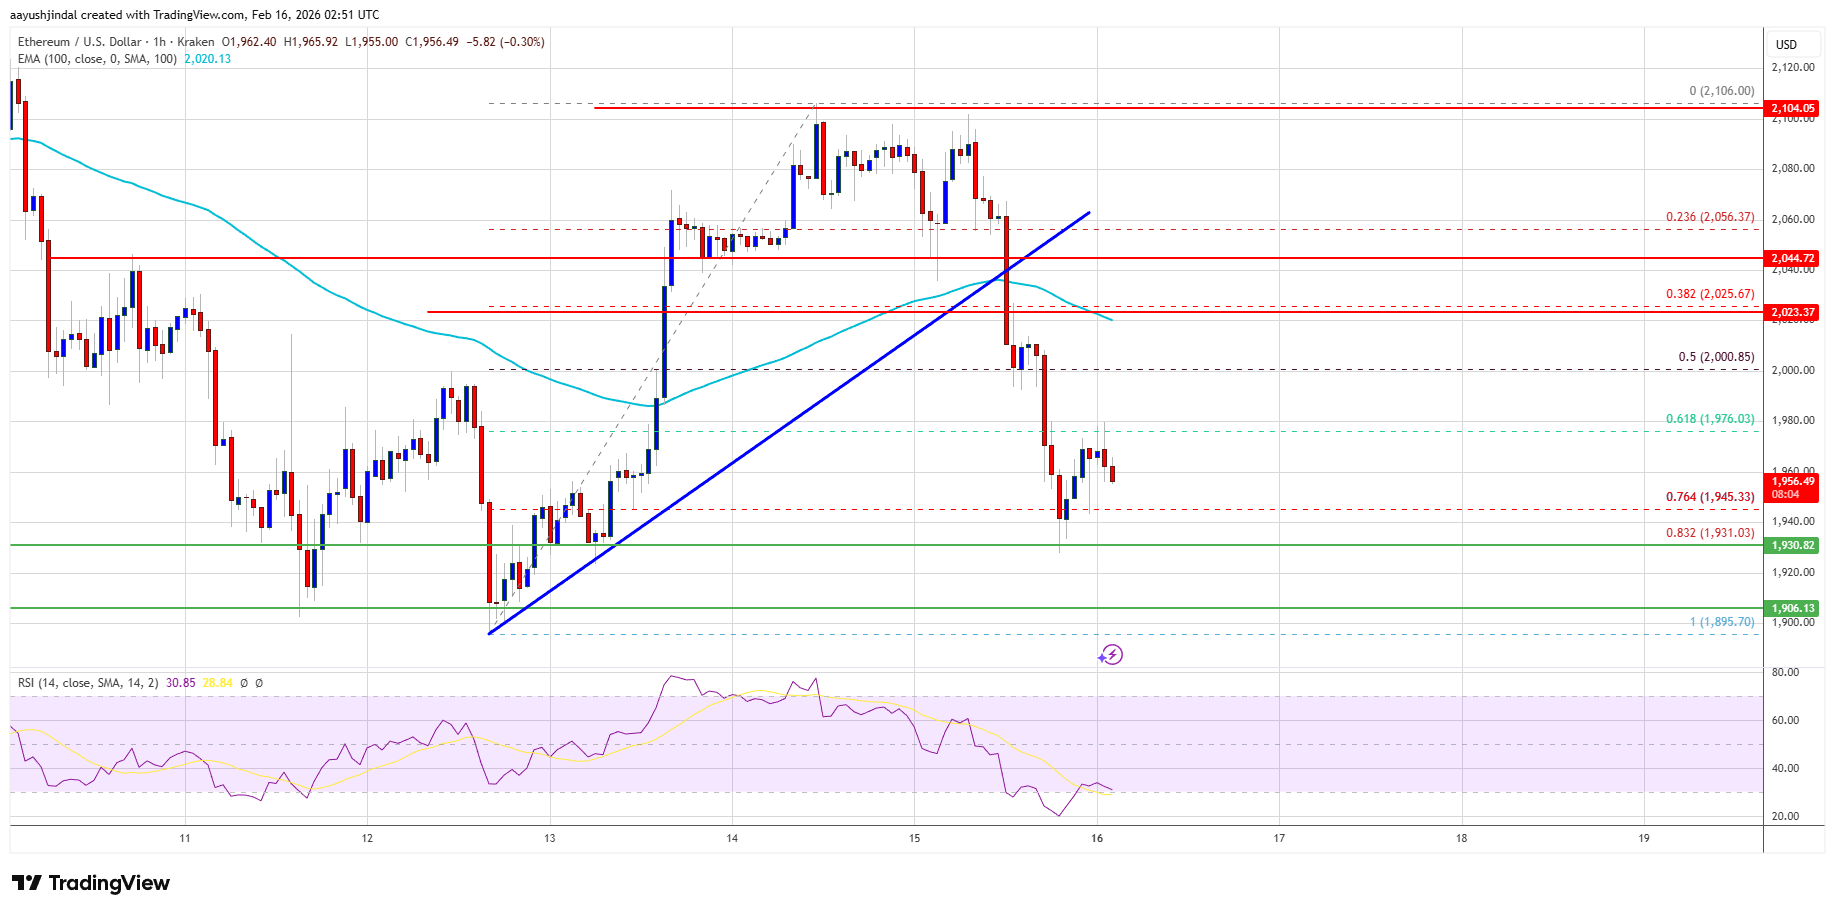
BEARISH 📉 : Ethereum price declines below $2,000 signaling potential further losses
Ethereum Price Analysis
- Ethereum's price declined below $2,000 after failing to sustain above $2,050.
- The price is currently trading under the 100-hourly Simple Moving Average.
- A break occurred below a bullish trend line with support at $2,035 on the ETH/USD hourly chart (via Kraken).
- ETH may face another decline if it remains below the $2,000 resistance zone.
Current Status
- Ethereum fell below the 50% Fibonacci retracement of its upward move from $1,895 to $2,106.
- Price is now below $1,980. Immediate resistance is around $1,980, with key resistance at $2,000 and $2,025.
Potential Movements
- If Ethereum exceeds $2,025, it may rise towards $2,045 and potentially $2,120 or $2,150.
- If unable to clear $2,000, a decline could occur with initial support at $1,945 and major support at $1,930.
- Further declines might push the price to $1,880 or even $1,820, with main support at $1,780.
Technical Indicators
- Hourly MACD is gaining momentum in the bearish zone.
- Hourly RSI for ETH/USD is below the 50 level.