Ethereum Price Drops Below $3,550 with Bearish Momentum
Ethereum price declined below the $3,550 level, indicating bearish momentum and potential further declines below $3,150.
- Ethereum dropped below the $3,550 zone.
- The price is trading under $3,500 and below the 100-hourly Simple Moving Average.
- A key bearish trend line is forming with resistance at $3,420 on the hourly chart of ETH/USD (data feed via Kraken).
- Further declines are likely if the price fails to hold above the $3,550 support zone.
Ethereum Price Movement
Ethereum struggled to increase above the $3,550 mark and continued its decline alongside Bitcoin. The price fell below $3,450 and traded beneath $3,300.
It reached a low of $3,100 after dropping below $3,220 and $3,120. Currently, Ethereum is consolidating losses following a close below the 50% Fib retracement level from the $3,100 swing low to the $3,553 high.
Ethereum is now trading below $3,500 and the 100-hourly Simple Moving Average. The bearish trend line shows resistance at $3,420 on the ETH/USD hourly chart.
The price is testing the 76.4% Fib retracement level from the $3,100 swing low to the $3,553 high. Resistance is present near the $3,350 level, with the first major resistance at $3,400.
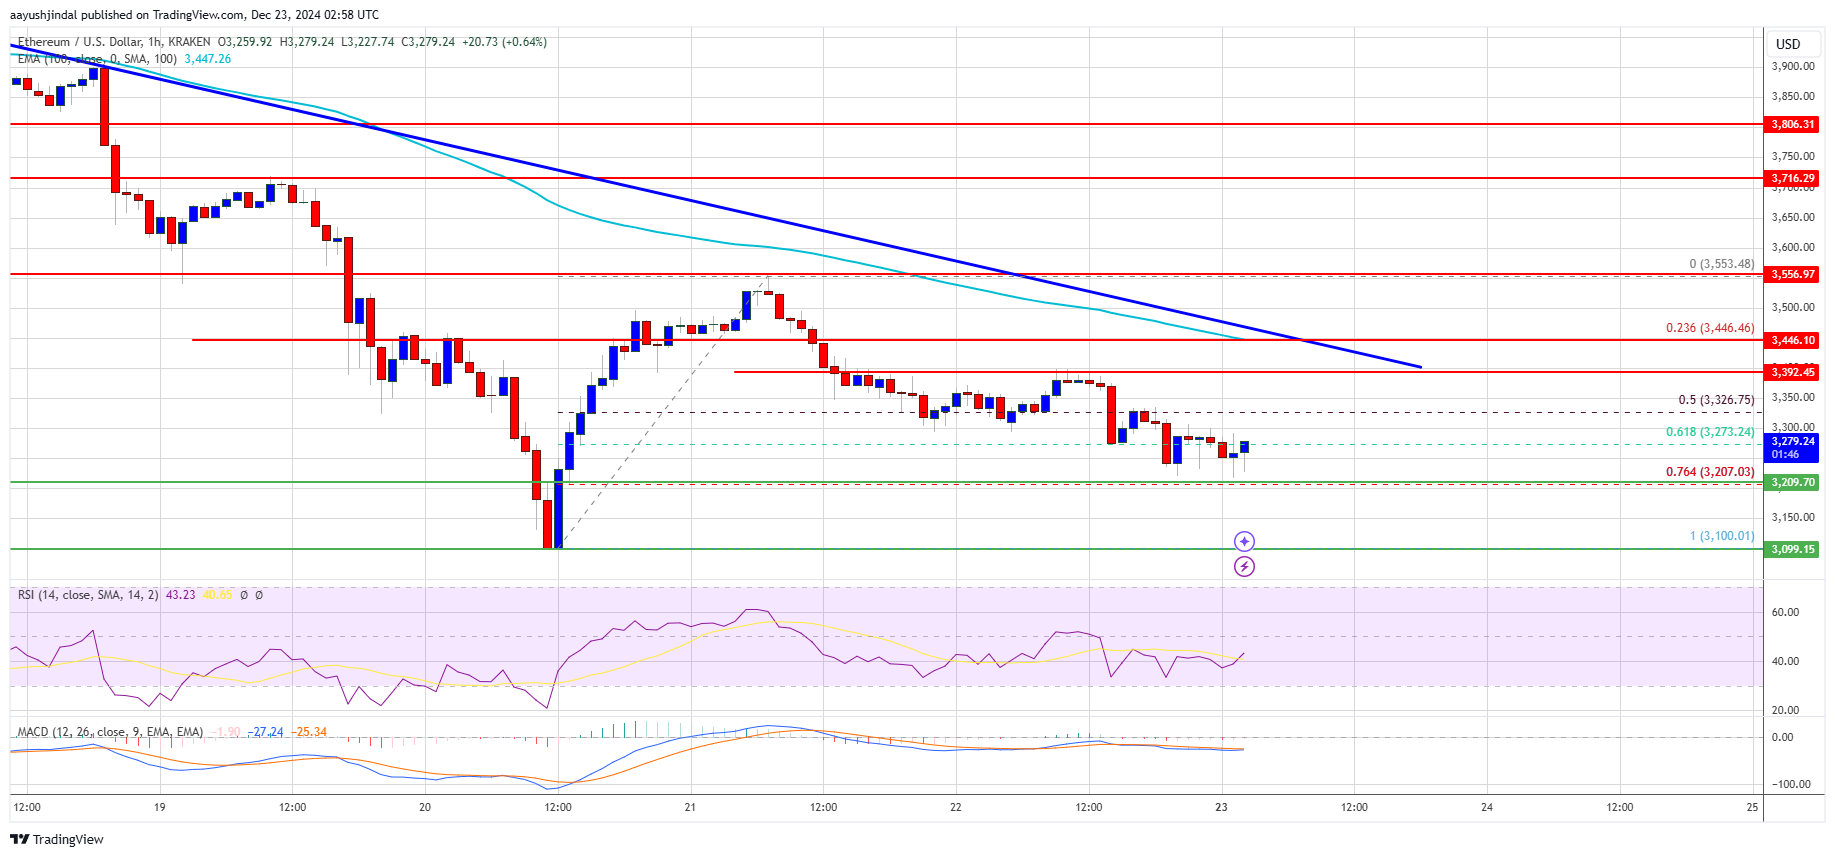
The primary resistance is near $3,420. A move above this level could lead to a rise toward $3,500 and potentially $3,650.
Potential for Further Losses
If Ethereum cannot surpass the $3,420 resistance, it may continue its downward trend. Initial support is around the $3,200 level, with major support at the $3,120 zone.
A significant drop below $3,120 could drive the price down to $3,050 and possibly towards $3,000 in the near term. The next crucial support level is at $2,880.
Technical Indicators
Hourly MACD: The MACD for ETH/USD shows increasing bearish momentum.
Hourly RSI: The RSI for ETH/USD is currently below the 50 threshold.
Major Support Level: $3,120
Major Resistance Level: $3,420