Feb 3, 2026
8 0
BEARISH 📉 : Ethereum price struggles to maintain support, risks further decline
Ethereum Price Analysis
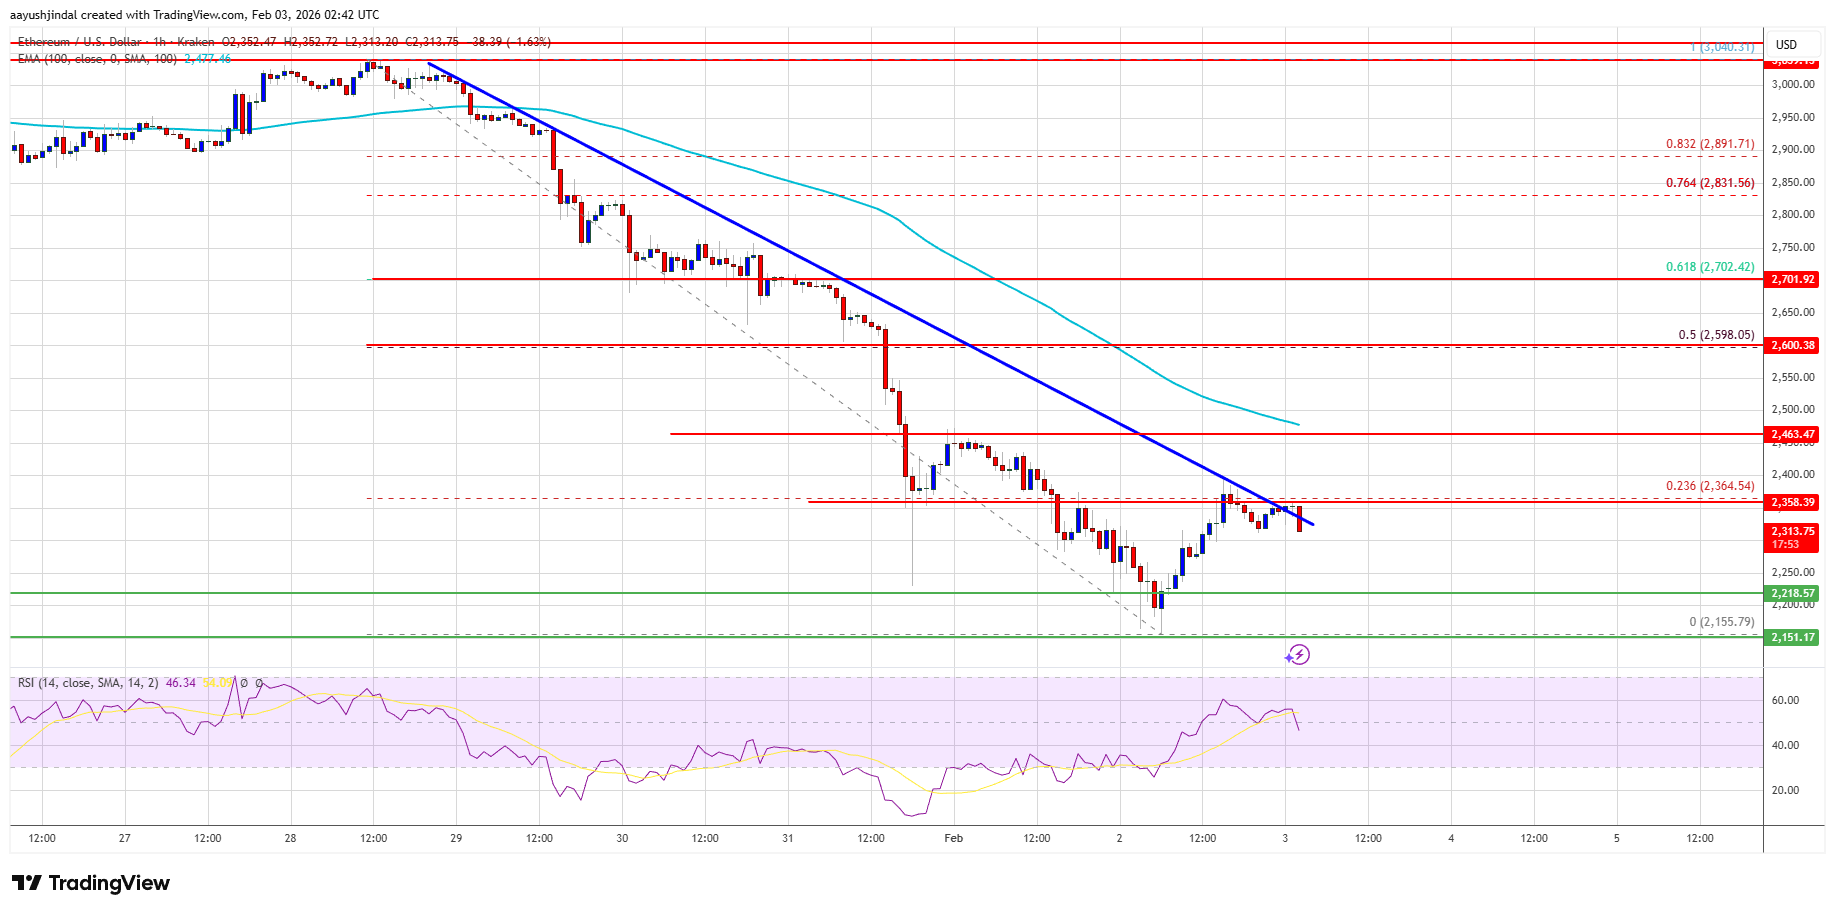
- Ethereum's price continues to decline, breaking below $2,420 and $2,300.
- Currently trading under $2,350 and the 100-hourly Simple Moving Average.
- A significant bearish trend line is forming with resistance at $2,350 on the ETH/USD hourly chart.
- The price is attempting recovery from a low of $2,155 but faces hurdles near $2,365.
Resistance and Support Levels
- If bulls push above $2,250, immediate resistance is at $2,350, with key resistances at $2,365 and $2,450.
- A breach above $2,450 might target $2,600 or the 50% Fib retracement from $3,040 to $2,155.
- Further gains could lead to $2,700 or $2,720.
Potential Decline
- If unable to surpass $2,365, Ethereum may decline again.
- Initial support is at $2,250, followed by major support at $2,220.
- A drop below $2,220 could drive prices to $2,150 or even $2,120.
- Main support is projected around $2,000.
Technical Indicators
- Hourly MACD: Gaining momentum in the bearish zone.
- Hourly RSI: Below the 50 zone.
Key Levels
- Major Support Level: $2,220
- Major Resistance Level: $2,365