Feb 19, 2026
1 0
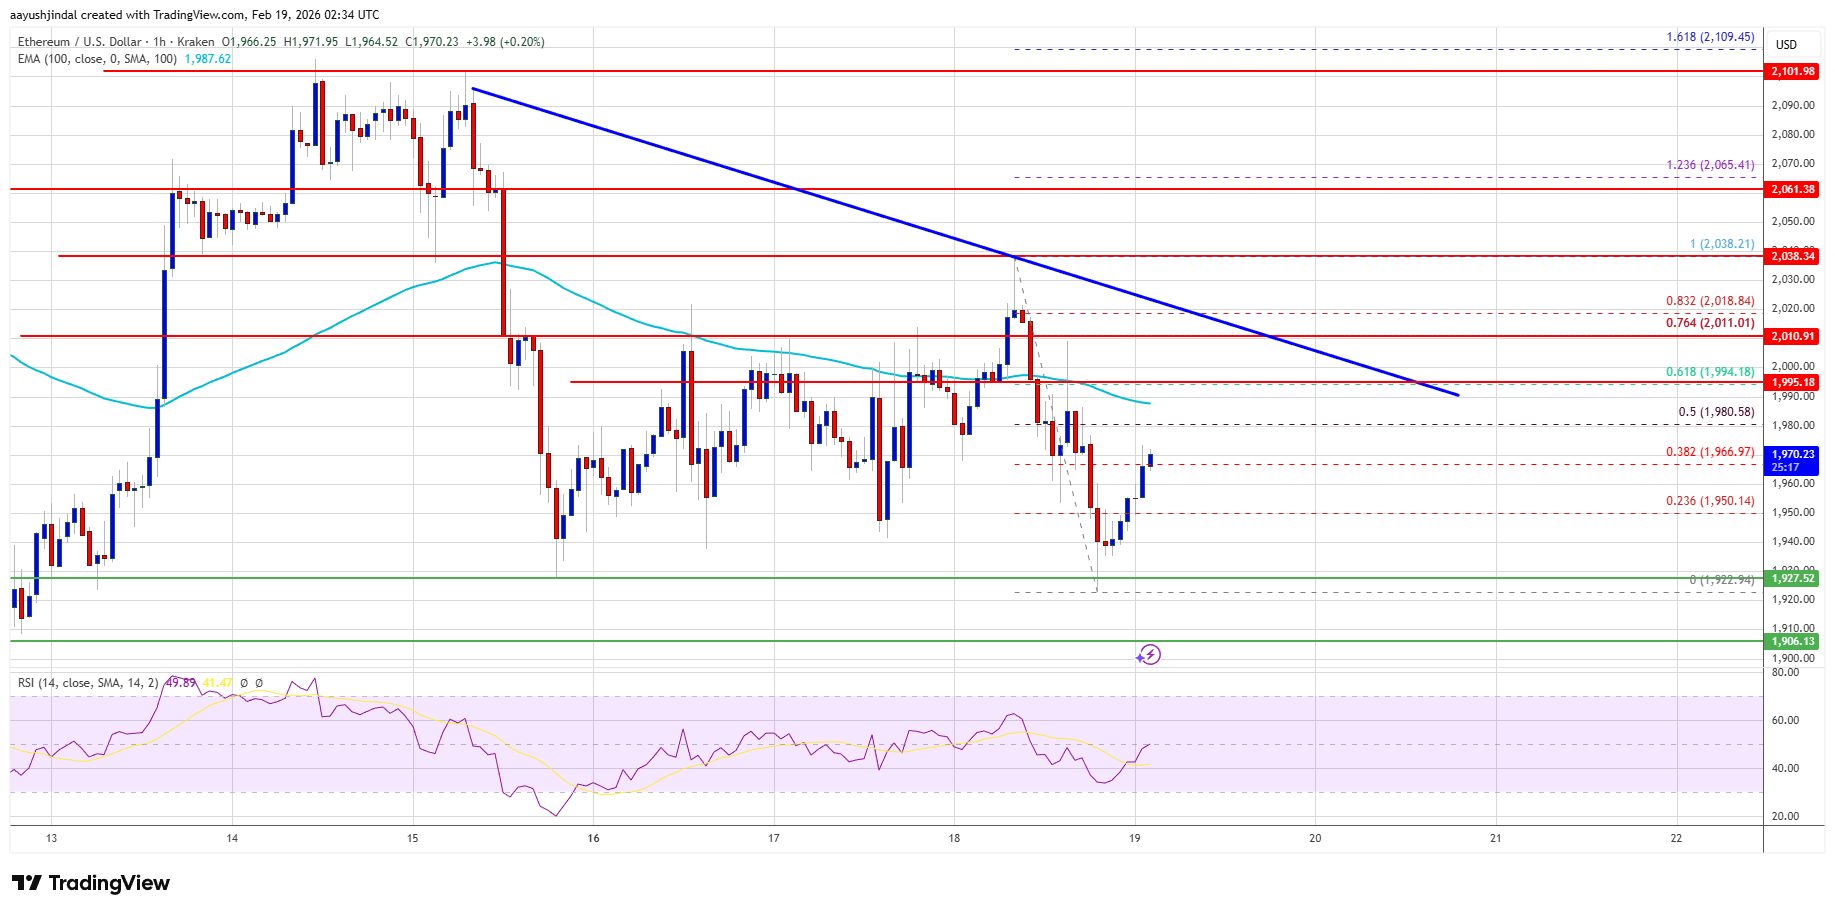
BEARISH 📉 : Ethereum struggles under $2,000 resistance amid potential decline
Ethereum Price Analysis
- Ethereum found support near $1,922 and is attempting a recovery wave above $1,960.
- ETH is trading below $1,985 and the 100-hourly SMA, facing resistance at $2,000.
- A bearish trend line is forming on the hourly chart with resistance at $2,000.
- The price could decline again if it remains below the $2,000 zone.
Price Movement and Key Levels
- Ethereum fell below $2,000, entering a bearish zone with a low at $1,922.
- The price surpassed the 38.2% Fib retracement level from $2,038 to $1,922.
- If bulls hold above $1,925, ETH might aim for the $2,000 resistance, potentially reaching $2,020 or $2,050.
- An upside break could drive the price towards $2,120 or $2,150.
Potential Decline
- If Ethereum fails to clear $2,000, support lies at $1,935 and $1,925.
- Breaking below $1,925 could lead to further declines toward $1,880 or $1,840.
- Main support is expected at $1,820.
Technical Indicators
- Hourly MACD: Losing momentum in the bullish zone.
- Hourly RSI: Near the 50 zone.
- Major Support Level: $1,920.
- Major Resistance Level: $2,000.