Ethereum Trading at $3,400 Amid Symmetrical Triangle Pattern
Ethereum (ETH) Market Overview
Ethereum is trading around $3,400, indicating indecision as it struggles to establish strong support. Recent price action reflects uncertainty among traders, yet ETH maintains above key support zones that could facilitate a rally.
Top crypto analyst Carl Runefelt provided insights on Ethereum’s price movement, noting that ETH has remained within a 4-hour symmetrical triangle formation over the weekend, signaling potential consolidation and a forthcoming breakout. Maintaining these key levels is crucial to prevent downside pressure.
Ethereum Testing Liquidity To Move
After weeks of lackluster price action, Ethereum is poised for a decisive move, but the direction remains uncertain. Runefelt emphasized that ETH's trajectory is closely tied to Bitcoin's performance, making BTC's next move critical.
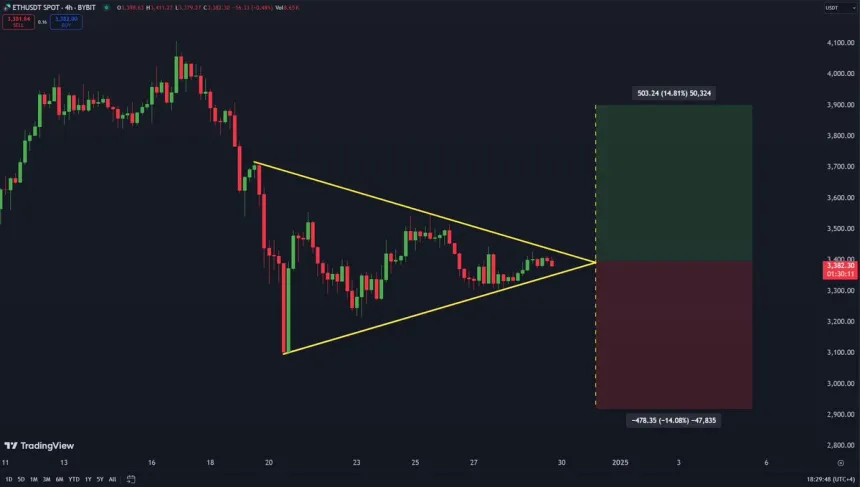
Runefelt identified targets for ETH based on Bitcoin's behavior: if BTC gains upward momentum, ETH could rise toward $3,900; if BTC declines, ETH may drop to the next support level at $2,920. A confirmed breakout could set the tone for ETH’s price action in the coming weeks.
Technical Levels To Keep An Eye On
Currently, Ethereum trades at $3,400, having oscillated between $3,300 and $3,500, reflecting market indecision. The tight range illustrates the struggle between bulls and bears awaiting a clear signal.
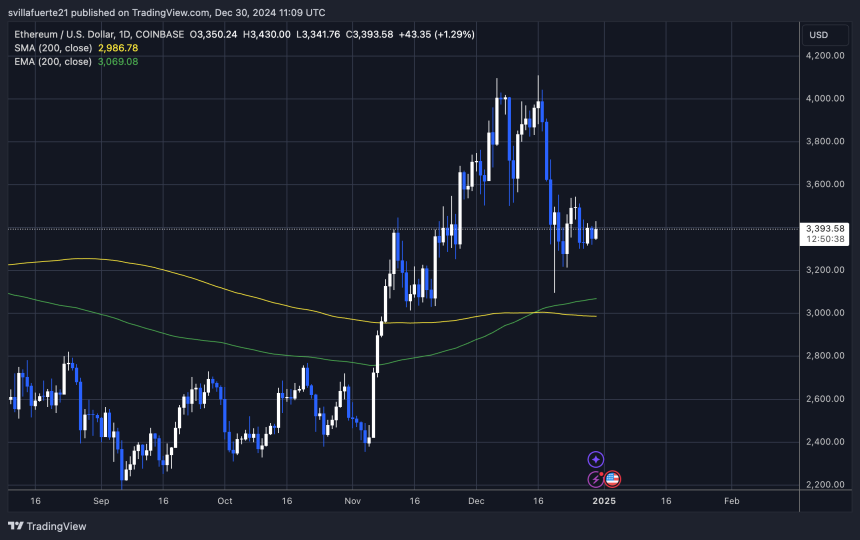
For bullish momentum to regain control, ETH needs to reclaim the $3,550 level as solid support, potentially triggering a rally toward higher resistance zones. Conversely, losing the $3,300 support could expose Ethereum to sub-$3,000 levels, increasing selling pressure.
The coming days are critical for Ethereum as traders watch price behavior around these key levels. Market dynamics, including Bitcoin's performance and macroeconomic trends, will heavily influence whether ETH surges or corrects further. Ethereum's current indecision reflects a market at a crossroads, with participants eager for clarity.
Featured image from Dall-E, chart from TradingView