Nov 18, 2025
13 1
Investing.com Unveils AI Chart Analysis Tool for Trading Plans
Investing.com Launches AI-Powered Chart Analysis
- Investing.com introduced an AI-driven chart analysis feature on Nov. 18, utilizing Vision AI for visual interpretation of charts.
- The tool provides complete trading plans with specific technical indicators, analyzing cryptocurrencies like Bitcoin (BTC) and Ethereum (ETH).
- It serves over 60 million investors monthly, covering various assets such as stocks and forex.
- CTO Yonatan Adest emphasized the system's ability to process visual chart information, differing from standard chatbots.
- Users receive 10 free credits for two full analyses; paid options start at $14.99/month for 50 credits.
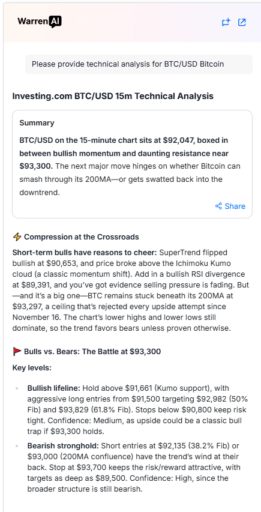
- Testing on BTC charts showed precise outcomes, like a 200-day moving average at $93,297 and Fibonacci retracement levels.
- The system also identified a bullish RSI divergence at exactly $89,391.
- The feature launched in 30 languages on desktop and mobile web; a mobile app is forthcoming.
- CEO Omer Shvili highlighted the tool's capability for data-driven insights without emotional biases.
- Recent trends include AI-powered trading integrations, such as CoincidenceAI's collaboration with Crypto.com.