Mar 18, 2025
12 0
MicroStrategy Forms Double Bottom Pattern Indicating Potential Bull Run
A bullish technical pattern is emerging for MicroStrategy (MSTR), indicated by a double bottom formation on its price chart. Key details include:
- The pattern consists of two consecutive troughs at similar price levels, signaling potential exhaustion of the downtrend.
- A trendline, or neckline, connects the high point between the troughs.
- A breakout above the neckline confirms a shift from bearish to bullish sentiment.
- In MSTR's case, the gap between the troughs and neckline exceeds 35%, suggesting a strong potential for upward movement.
- The current double bottom is observed around $230 with resistance at approximately $320.94.
- A breakout past this resistance could indicate a rally toward $410.
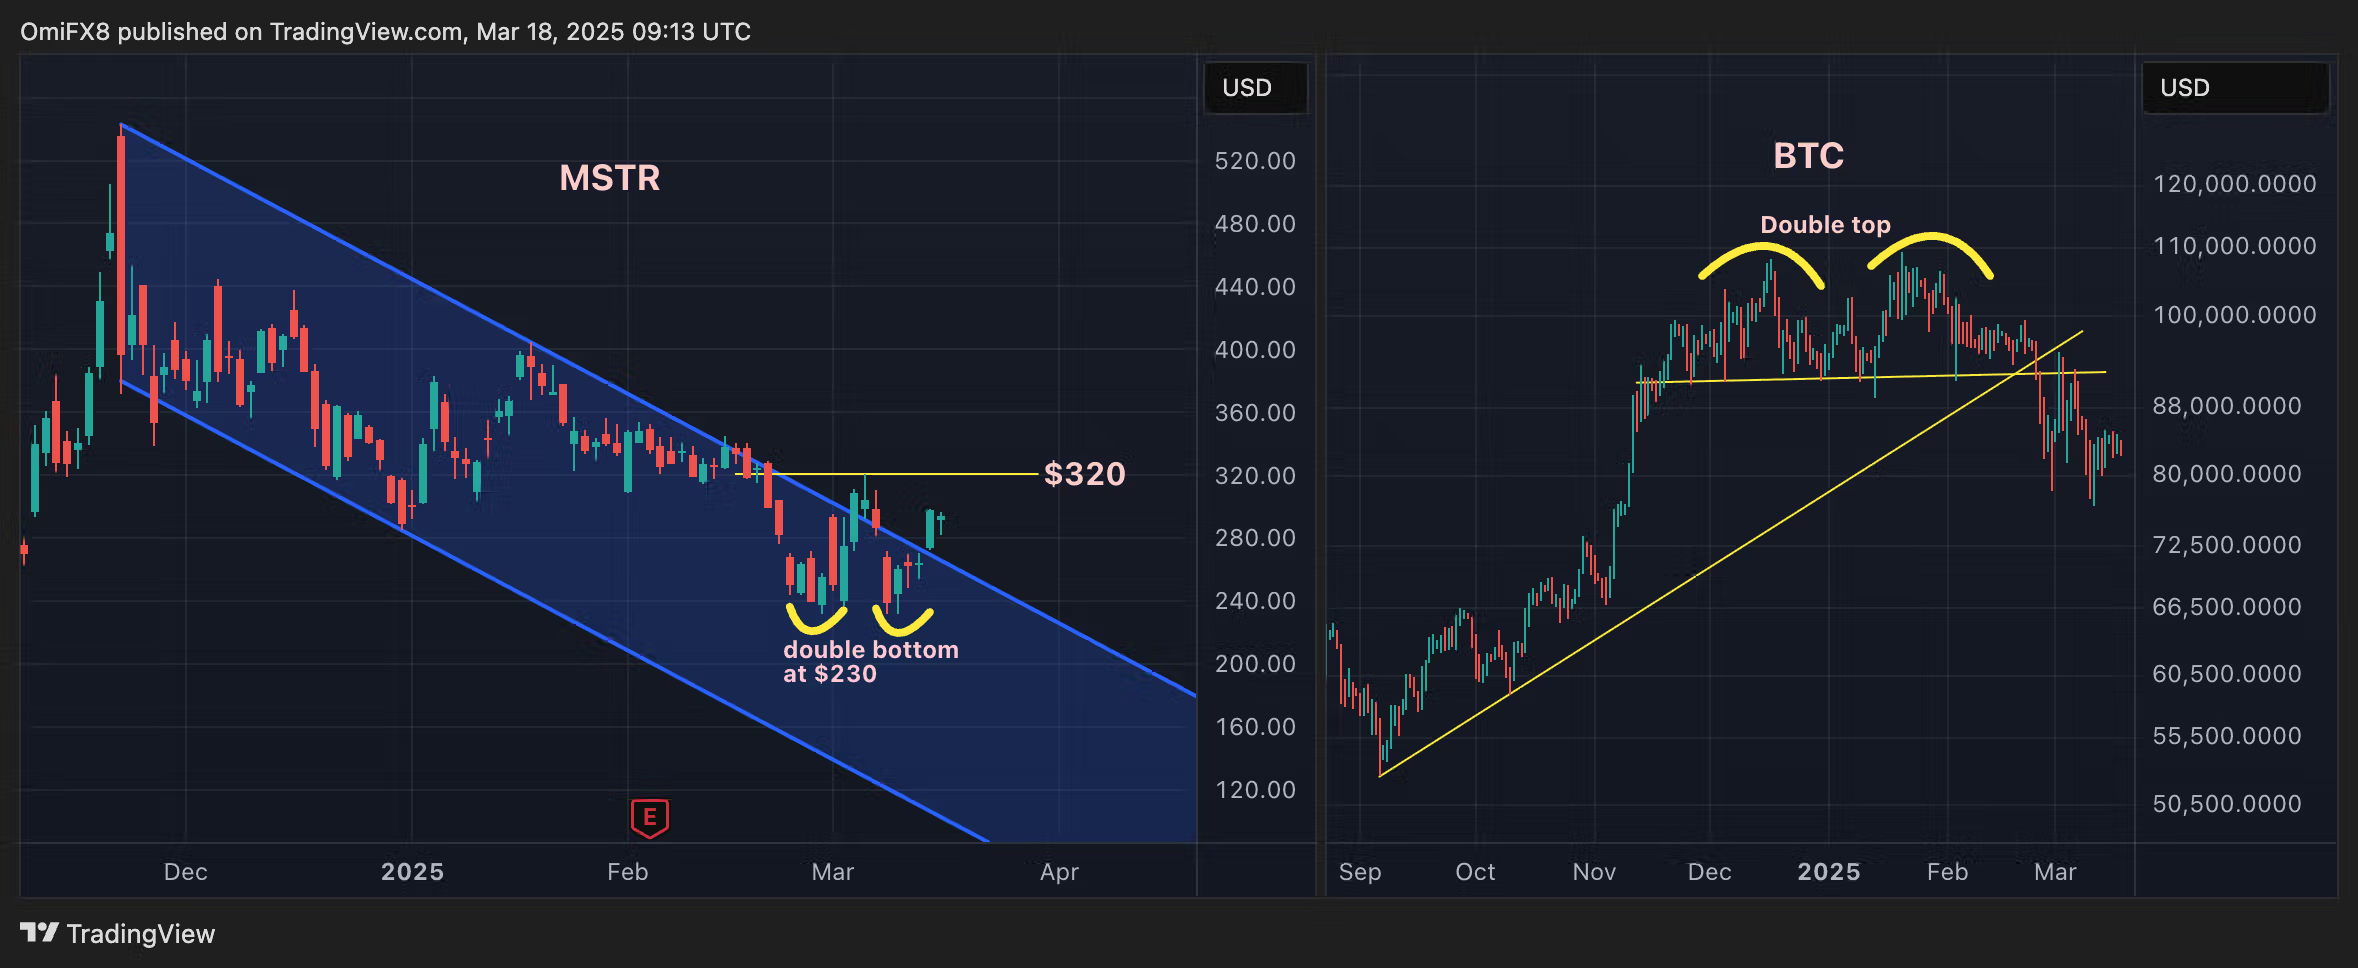
In contrast, Bitcoin (BTC) has shown a bearish double top pattern, leading to a decline below $91,000, with prices recently falling to $76,800. Historical analysis suggests that double bottoms and tops have low failure rates, often resulting in significant price movements.
MicroStrategy remains the largest publicly traded holder of bitcoin, with a portfolio of 499,096 BTC valued at $41.5 billion.