PEPE Faces Potential 20% Decline Amid Massive 21 Trillion Supply
Bitcoin remains stable above $106,000 while meme coins like Dogecoin, Shiba Inu, and Pepe show a minor recovery of 1.0% to 2.2% over the past 24 hours. Pepe struggles to regain its $10 billion market cap with weekly returns at 4.97%. The question arises whether a broader market recovery can elevate Pepe's price to a new all-time high.
Consolidation at Key Support, PEPE Bulls at Risk
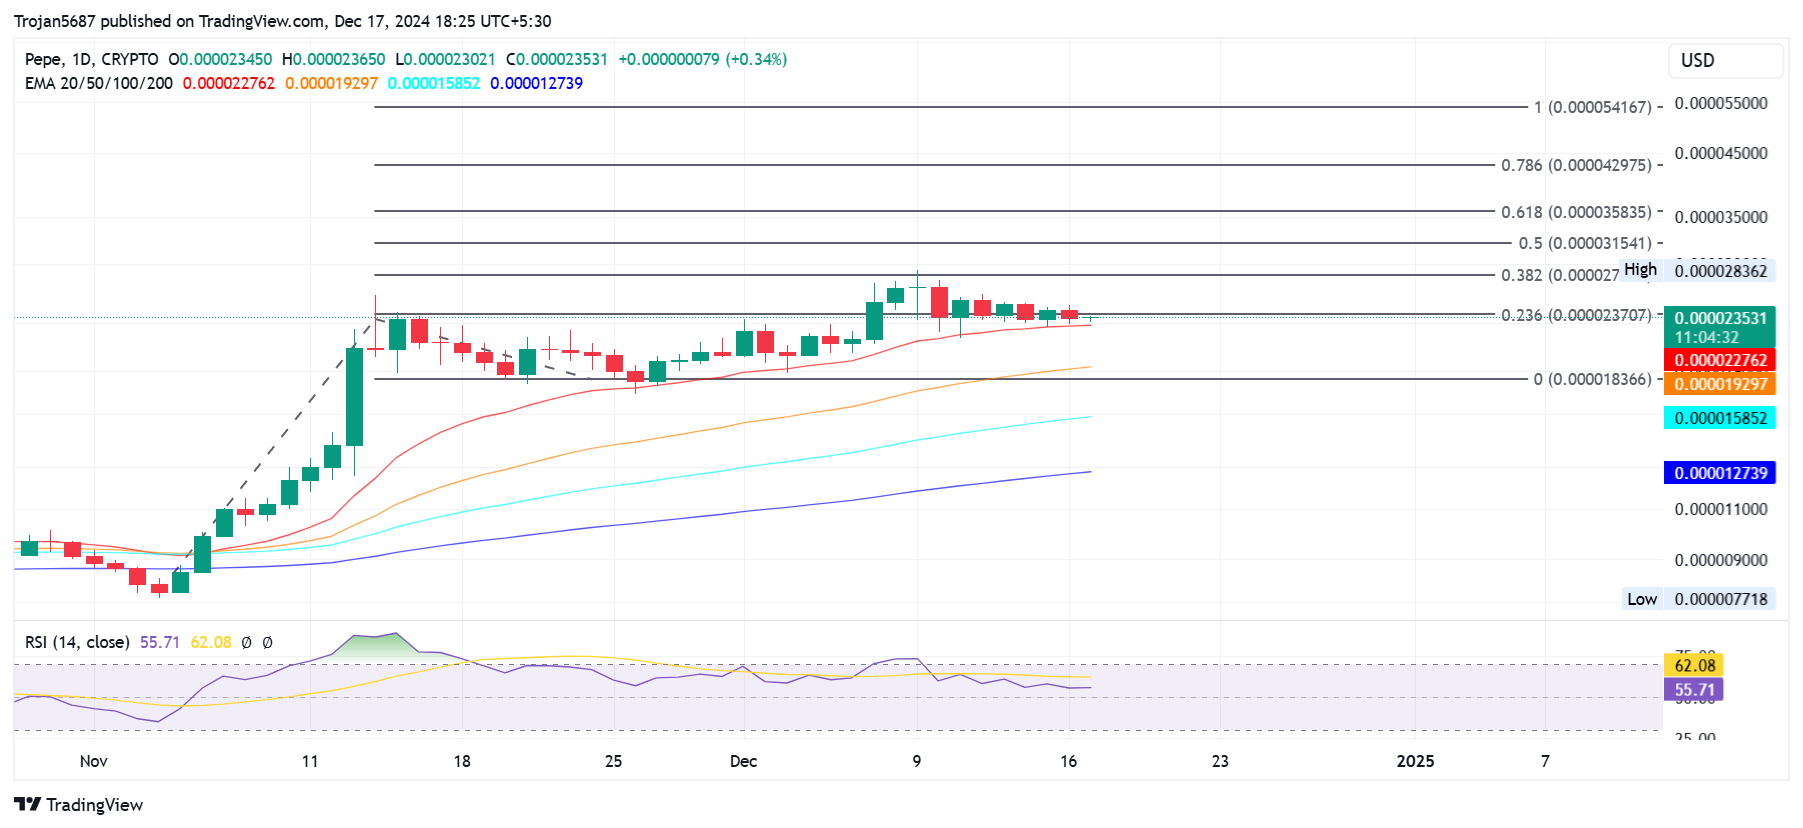
The daily chart for Pepe indicates a sideways trend with support at $0.00002311. Multiple lower price rejection candles suggest dominance above $0.000023, although supply pressure is increasing. The current rally is forming higher lows while retesting previous swing highs.

Pepe currently trades at $0.00002345, showing a slight intraday move following a 2.92% drop yesterday. Fibonacci levels indicate that the consolidation range is supported at the 23.60% level.
Despite the consolidation, the daily RSI line shows a declining trend, indicating potential bearish continuation as it approaches the midpoint. The 20-day EMA acts as dynamic support, absorbing supply spikes, while the 50-day, 100-day, and 200-day EMA lines are aligned positively and ready to serve as support. The nearest dynamic support is at $0.00001929.
On-chain Reveals Massive Supply
The consolidation intensifies with significant supply overhead highlighted by the in-and-out-of-the-money indicator from IntoTheBlock. The immediate out-of-the-money range between $0.000023 and $0.000024 represents an incoming supply of $21.36 trillion held by 12.61k addresses, potentially looking to book profits. Despite this supply, 78.95% of trading volume remains “in the money.”

The positive “in the money” zone consists of 132.51 trillion Pepe tokens worth $3.08 billion, whereas the “out of the money” zone contains 35.3 trillion Pepe tokens valued at $821 million.
PEPE Price Targets
According to Fibonacci levels, a bullish recovery may encounter resistance at the 38.20% level of $0.000027762. Should the rally extend, targets include $0.00003583 (61.80%) and $0.00004297 (78.60%). Conversely, a bearish continuation could test support levels at the psychological mark of $0.000020 and horizontal support at $0.000018366.