Jan 9, 2026
1 0
Solana price climbs above $138, eyes further gains past $142
Key Points on Solana (SOL) Price Movement
- SOL price began an upward trend, moving above $136 and consolidating above $138.
- Currently trading above the $138 mark and the 100-hourly simple moving average.
- A break occurred above a bearish trend line with resistance at $137 on the SOL/USD chart (Kraken data).
- Potential for further gains if the $142 resistance zone is surpassed.
Price Analysis
- After correcting from $144, SOL maintained stability above $130, outperforming Bitcoin and Ethereum.
- It re-entered a positive zone by climbing past $135, breaking a bearish trend line at $137.
- Facing resistance near $140 and the 76.4% Fib retracement level; next major resistance is at $142.
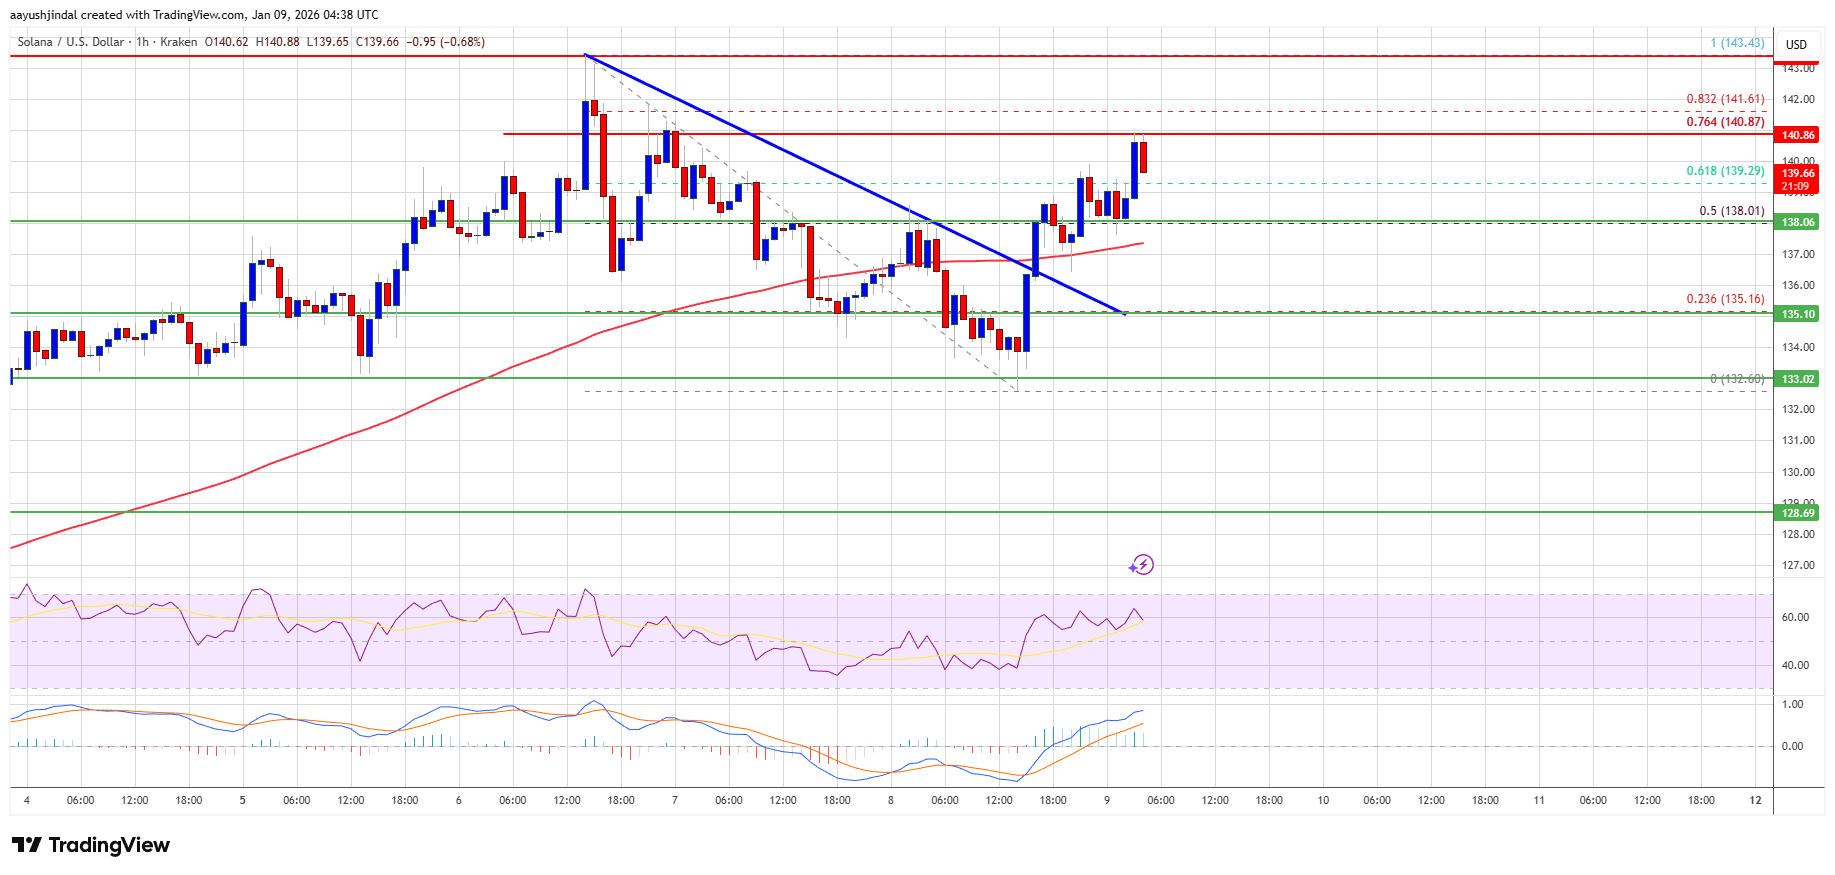
- If SOL closes above $145, it may pave the way for further increases towards $150 and potentially $155.
Potential Decline
- If unable to surpass $140 resistance, SOL might decline.
- Initial support lies near $138, with major support around $135.
- A drop below $135 could push the price toward $132, and potentially $124 if $132 breaks.
Technical Indicators
- The MACD for SOL/USD shows bullish momentum.
- The RSI for SOL/USD is above 50, indicating strength.
- Major Support Levels: $138, $135
- Major Resistance Levels: $140, $142