Dec 17, 2025
8 0
Solana Faces Resistance at $132 Amidst Recovery Efforts
Solana (SOL) is experiencing a recovery wave, moving above the $126 level. However, it faces resistance around $132.
- SOL price has moved above $126 and $128 against the US Dollar.
- Currently trading below $130 and the 100-hour simple moving average.
- A bearish trend line with resistance at $132 is forming on the SOL/USD hourly chart.
Current Market Situation
After stabilizing at $124, Solana began a recovery, similar to Bitcoin and Ethereum, climbing above $126. The price surpassed the 23.6% Fib retracement of the drop from $136 to $124 but encountered resistance near $130.
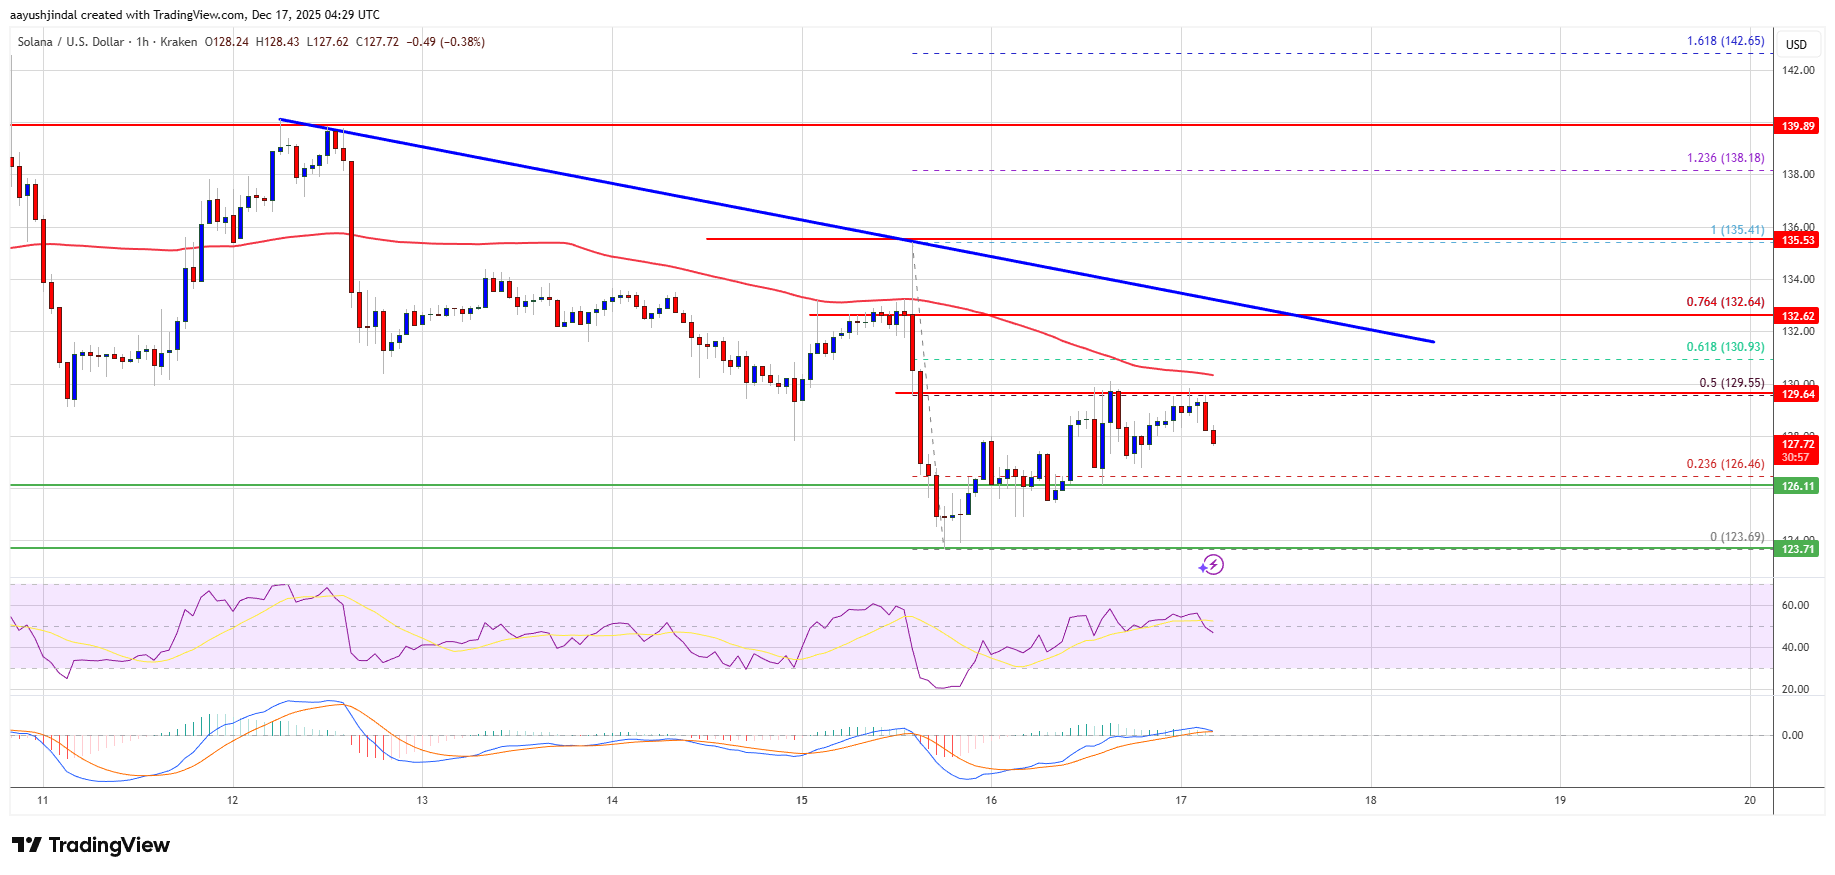
Resistance levels are $130, $132, and potentially $135. A close above $135 might lead to further gains toward $144 and $150.
Potential for Decline
- If SOL cannot surpass $132, it may decline, with initial support at $126 and major support at $124.
- A break below $124 could push the price toward $116, and potentially as low as $108 if $116 fails.
Technical Indicators:
- Hourly MACD: Bearish momentum increasing for SOL/USD.
- Hourly RSI: Below the 50 level, indicating potential downside pressure.
- Support Levels: $126 and $124.
- Resistance Levels: $130 and $132.