Jan 30, 2026
7 0
BEARISH 📉 : Solana struggles below $120 amid continued price decline
Solana Price Analysis
- Solana's price fell below $125, continuing its decline under $120 and $115.
- SOL is trading below $120 and the 100-hour simple moving average.
- A bearish trend line with resistance at $116 is forming on the SOL/USD hourly chart.
- Support levels at $112 and $105 could be critical for a recovery wave.
Solana recently dipped below key support levels at $125 and $122, similar to movements in Bitcoin and Ethereum. The price has consolidated after reaching a low of $112 and is showing minor recovery towards the 23.6% Fib retracement level from $128 to $112.
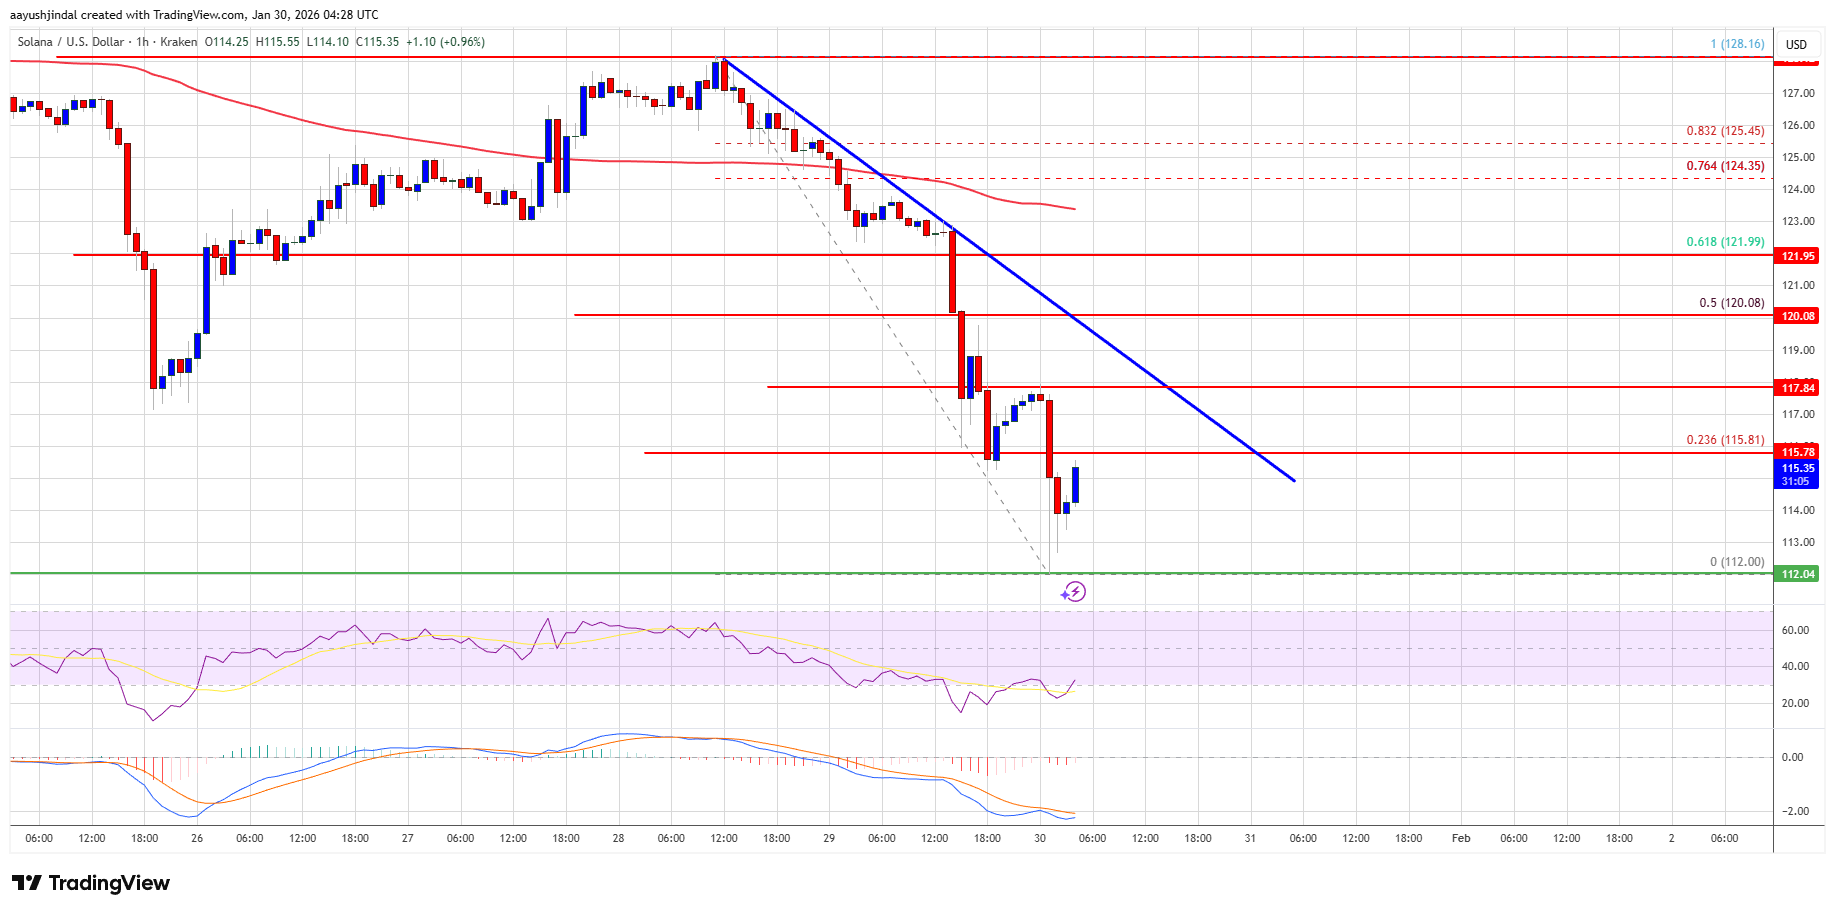
Resistance levels are near $116 and $120, with major resistance at $122. A break above these could lead to gains up to $132.
Potential Decline Risks
- If SOL doesn't rise past $116, further declines are possible.
- Initial support is around $114, with major support at $112.
- A drop below $112 might see prices fall to the $105 support zone, with a potential further decline to $102.
Technical Indicators
- The hourly MACD for SOL/USD is weakening in the bearish zone.
- The RSI is below 50, indicating bearish momentum.
- Major support at $112 and $105; major resistance at $116 and $120.