Feb 2, 2026
6 1
BEARISH 📉 : SUI struggles with Fibonacci support, downtrend pressure persists
SUI is experiencing pressure after hitting a key Fibonacci support zone, raising questions about whether the current pullback is temporary or indicates further decline.
Fibonacci Support Levels
- SUI has reached important Fibonacci-based support levels, with the 61.8% retracement near $1.20 and a broader support range between $0.91 and $1.70.
- These zones are identified using different analytical methods, highlighting potential downside areas.
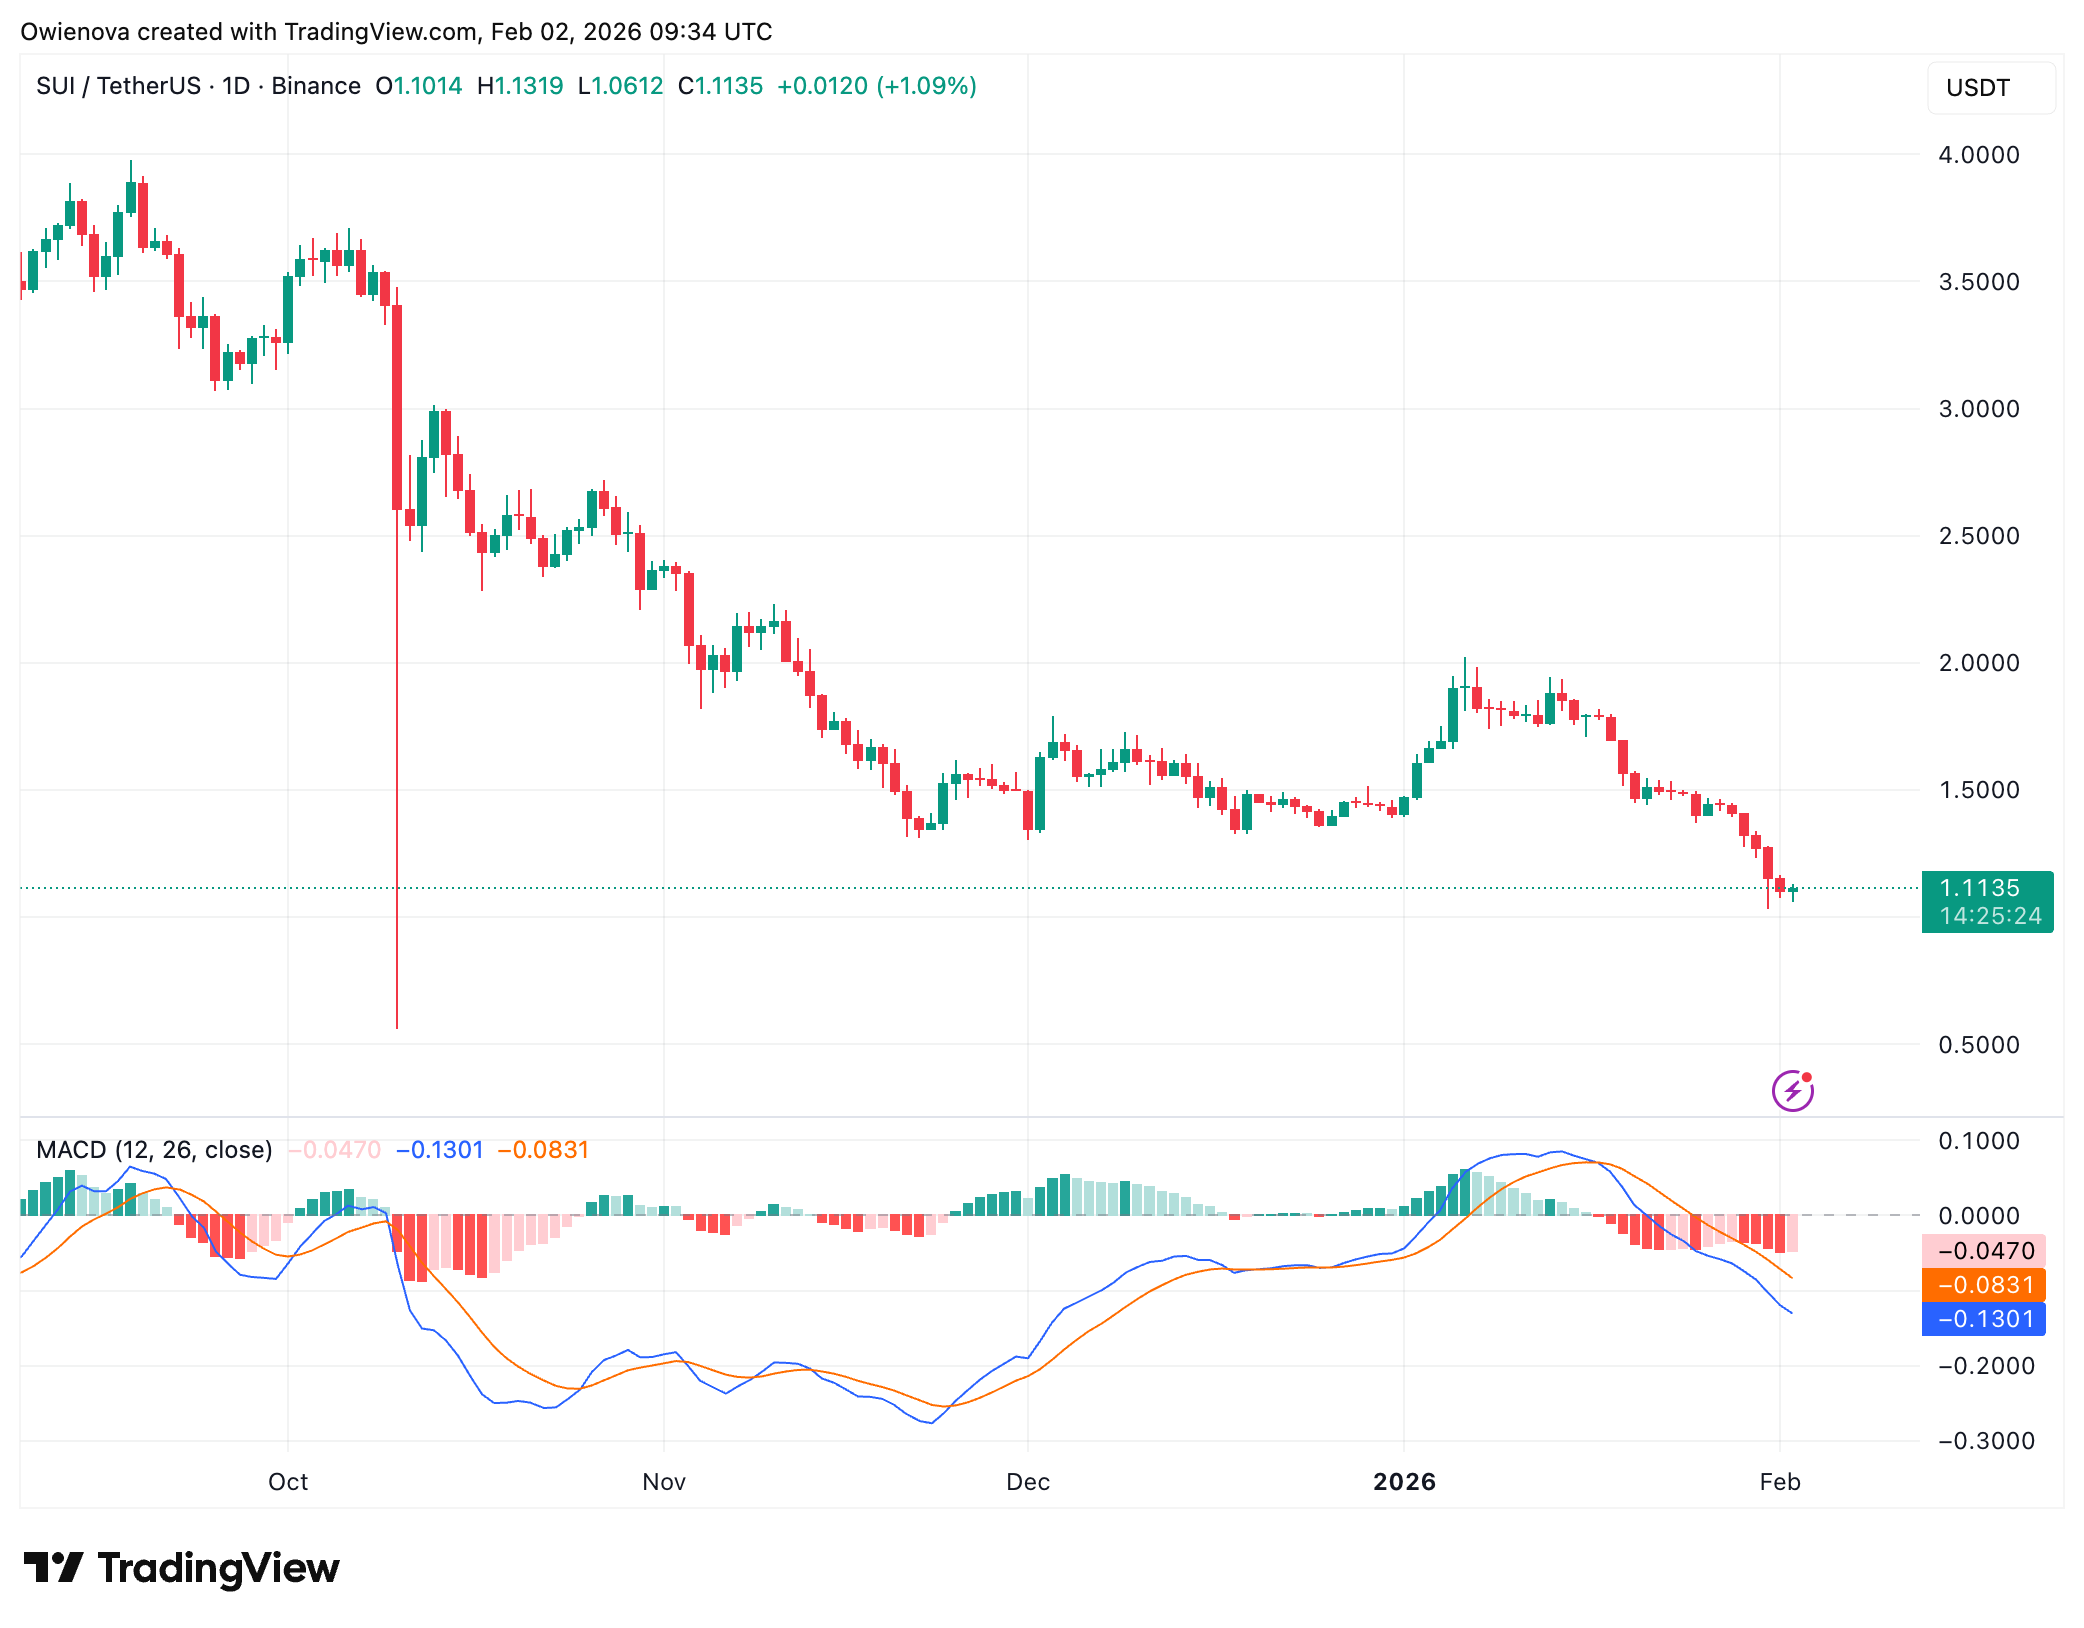
SUI shows relative weakness compared to Bitcoin, Ethereum, and Solana. It has broken below its April 2025 low, indicating persistent downside pressure.
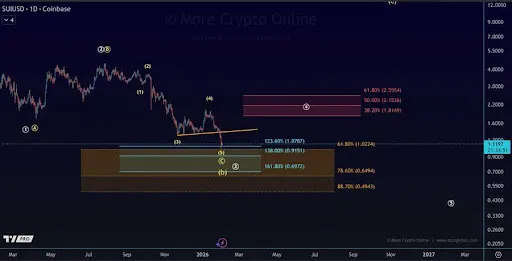
The analysis suggests the breakdown may be part of a fifth wave down within circle wave C, or price movement through circle wave 3 of a larger bearish sequence. No technical signs confirm a local bottom yet.
Bearish Scenarios
- Yellow and white scenarios suggest further downside possible without clear reversal signals.
- In the white scenario, SUI might be in a third wave down, potentially reaching $0.915 or lower.
- The yellow scenario allows for future recovery and new highs, but requires a clear five-wave upward move to validate bullish momentum.
Without confirmation of an impulsive rally, any upward movement is likely a corrective wave 4 within the white scenario, facing resistance between $1.81 and $2.55.