4 0
XRP and Bitcoin Show Tightly Compressed Spring-Like Price Action
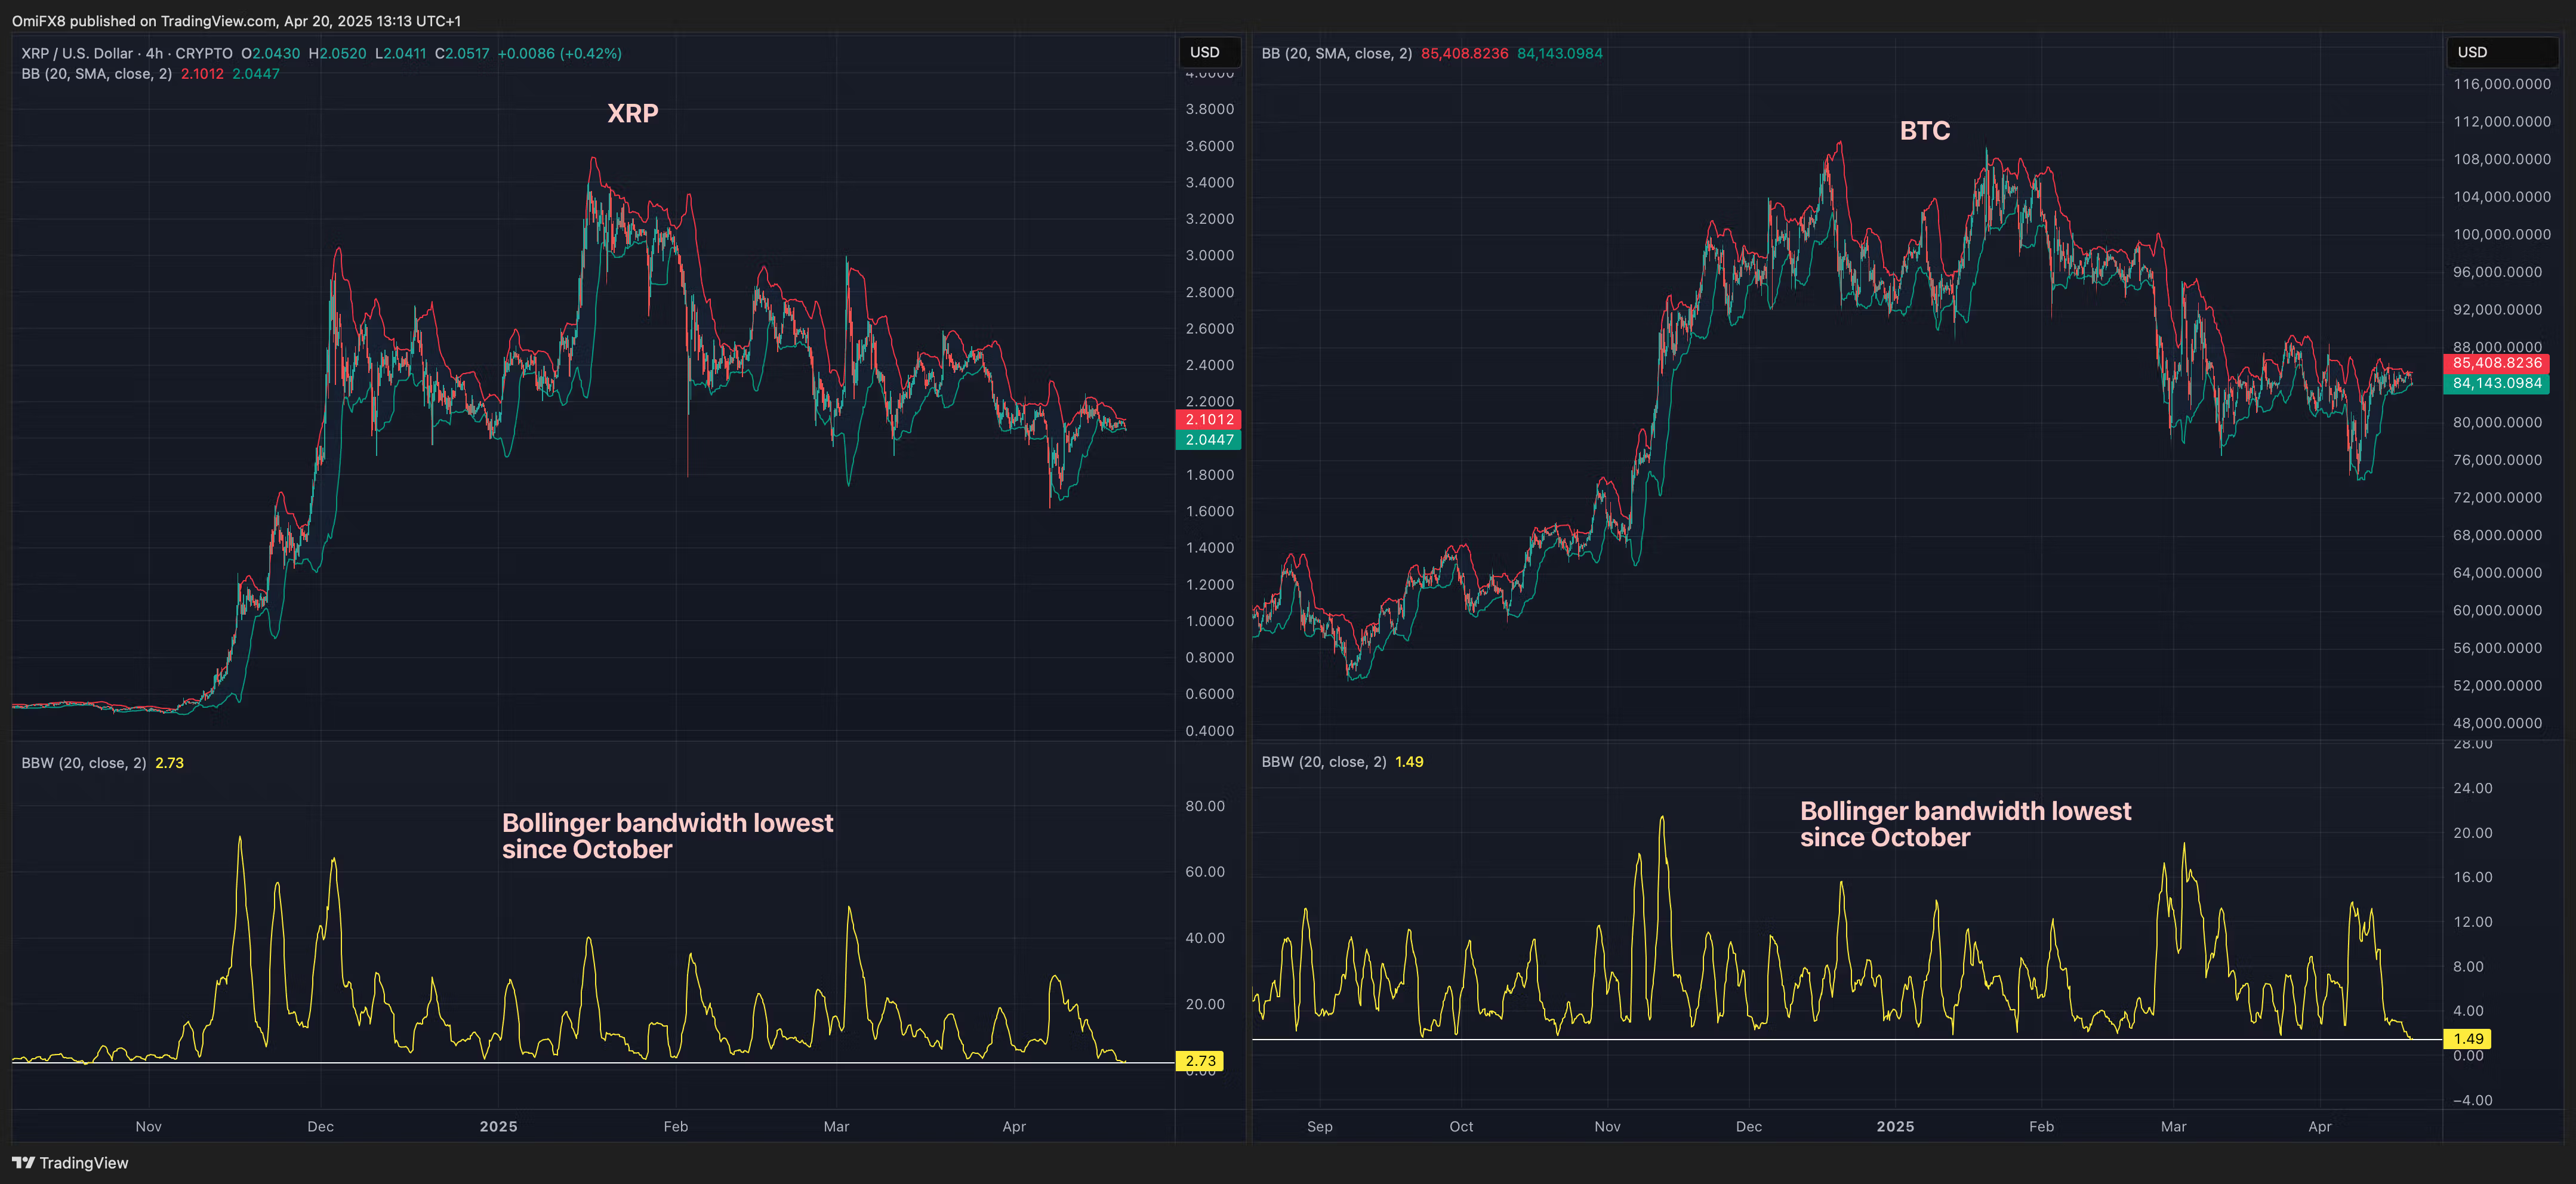
The Bollinger Bandwidth indicator suggests potential volatility in the price movements of XRP and Bitcoin (BTC). Key points include:
- Bollinger Bands measure market price volatility using the 20-period moving average.
- XRP's Bollinger bandwidth has reached its lowest level since October 2024 on the 4-hour chart.
- Bitcoin's 4-hour chart shows a similar pattern to XRP.
- Tighter Bollinger bandwidth often indicates a significant price movement is imminent, either upward or downward.
- Both tokens previously surged in late 2022 after similar bandwidth conditions.
- Tighter bands do not guarantee bullish trends; they can also presage sell-offs, as seen in October 2022.
- Factors such as recent comments from Federal Reserve Chairman Jerome Powell and whale selling may influence market direction.
