XRP Price Moves Above $0.6320 Support and Eyes Further Gains
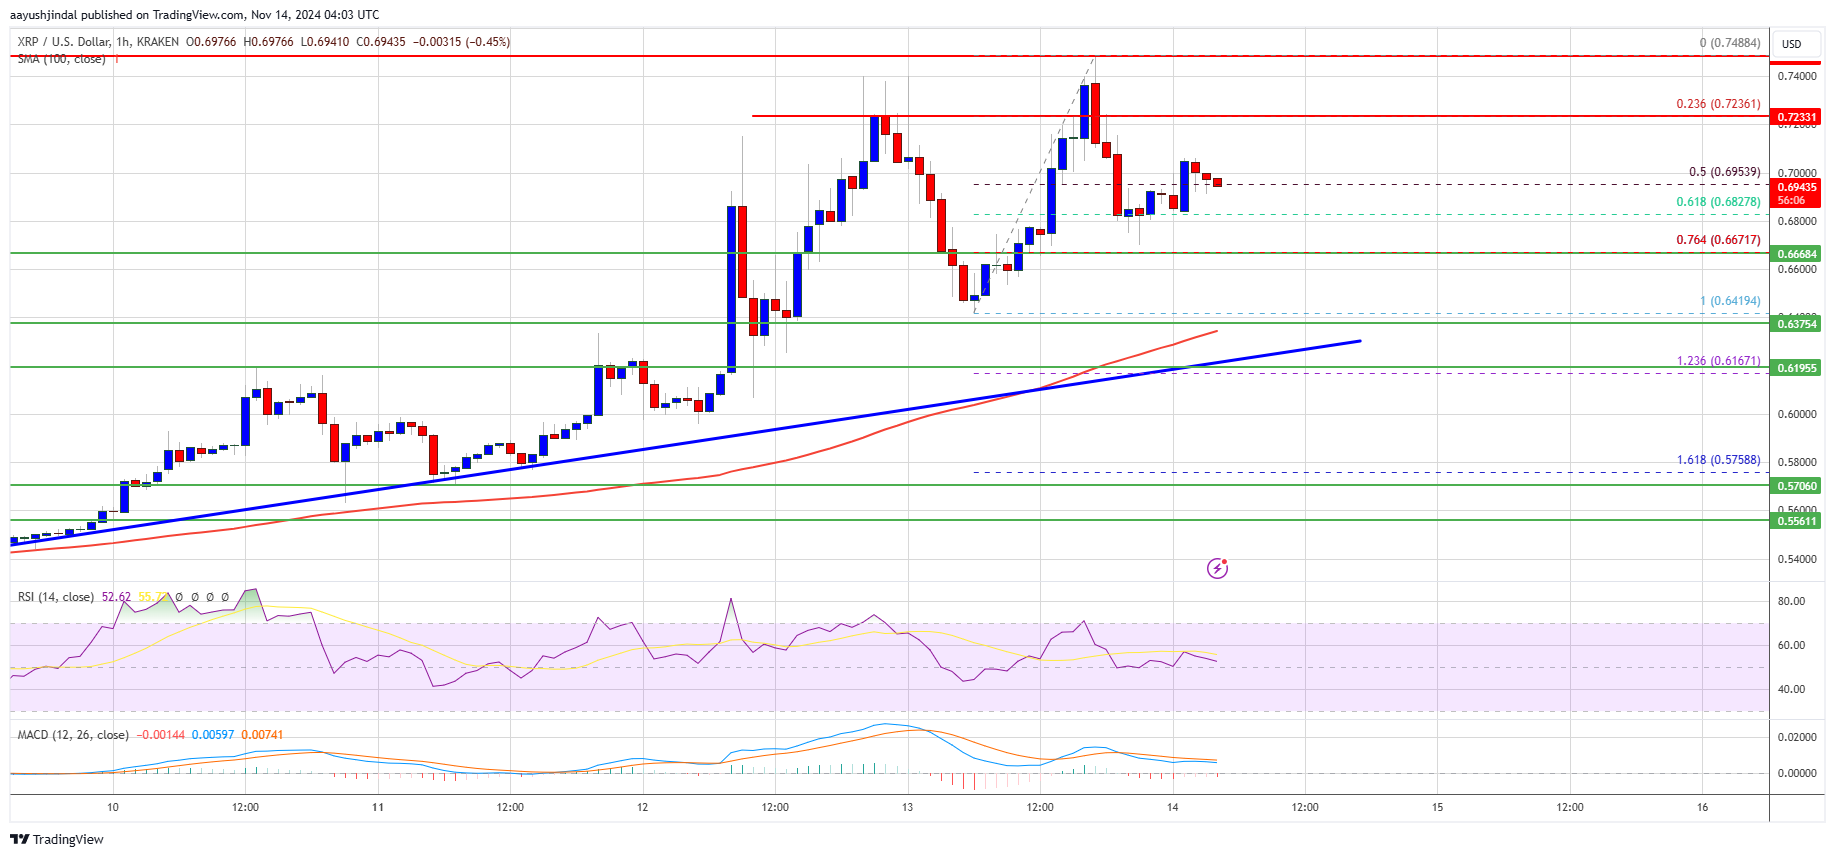
XRP price is gradually increasing above the $0.6320 support zone, having tested the $0.7450 level and currently undergoing a correction.
- XRP price increased above the $0.6320 resistance.
- The price is trading above $0.6450 and the 100-hourly Simple Moving Average.
- A key bullish trend line is forming with support at $0.6280 on the hourly chart of the XRP/USD pair (data source from Kraken).
- The pair could rise further if it maintains levels above the $0.6160 support zone.
XRP Price Eyes More Upsides
XRP price remains supported above the $0.600 level, forming a base for an increase above $0.6200. It has outperformed Bitcoin and Ethereum in recent sessions, moving past the $0.6320 resistance.
The price peaked at $0.7488 before experiencing a pullback, dipping below $0.7200 to test the $0.700 mark and the 50% Fib retracement level from the upward move of $0.6419 to $0.7488.
Currently, XRP is trading above $0.6320 and the 100-hourly Simple Moving Average, with a bullish trend line at $0.6280.
Resistance may occur near the $0.7220 level, with major resistance at $0.7480 and a subsequent key resistance at $0.7550. A clear breakout above $0.7550 could target $0.7780.
Further gains could push the price toward $0.7950 or even $0.800, with the next significant hurdle at $0.8220.
Another Drop?
If XRP does not surpass the $0.7220 resistance, a decline may occur. Initial downside support is around $0.6820, followed by major support near $0.6670, coinciding with the 76.4% Fib retracement level of the move from $0.6419 to $0.7488.
A break and close below $0.6670 might lead to a decline towards the $0.6160 support, with additional major support near the $0.600 zone.
Technical Indicators:
Hourly MACD – The MACD for XRP/USD is losing momentum in the bullish zone.
Hourly RSI (Relative Strength Index) – The RSI for XRP/USD is above the 50 level.
Major Support Levels – $0.6820 and $0.6670.
Major Resistance Levels – $0.7220 and $0.7450.
