XRP Price Consolidates Above $1.450, Eyes Move Beyond $1.500
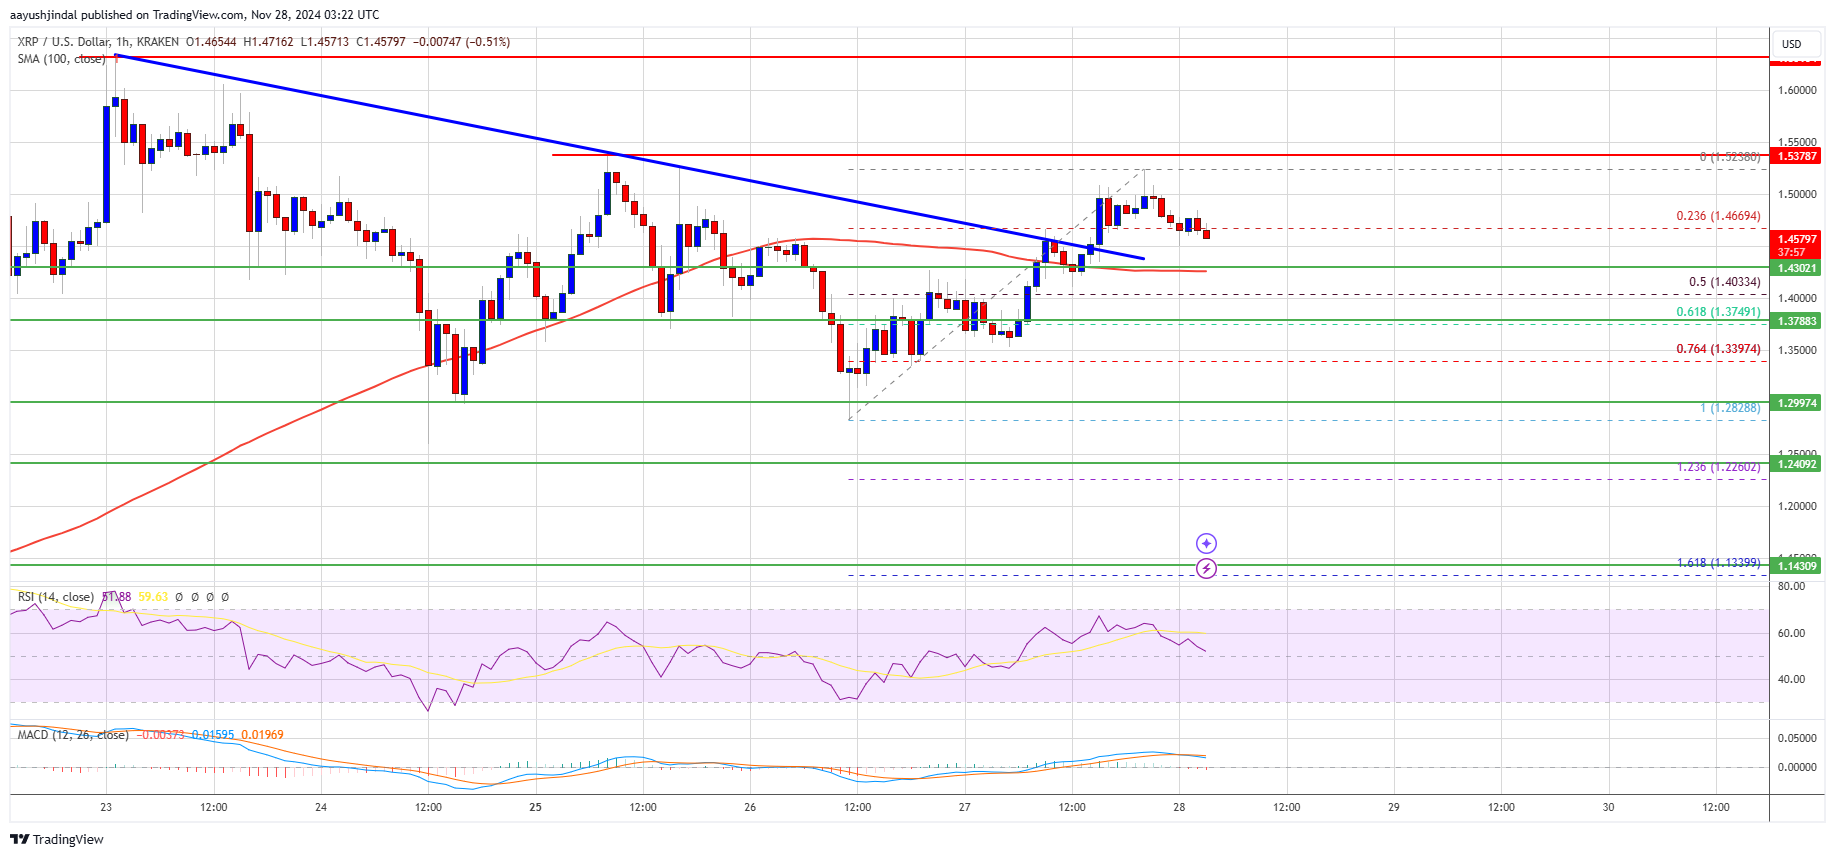
XRP price is consolidating near the $1.450 zone, indicating potential for a move above the $1.50 level.
- XRP price targets an increase above the $1.465 resistance zone.
- Current trading occurs above $1.450 and the 100-hourly Simple Moving Average.
- A key bearish trend line was broken, with resistance at $1.4580 on the hourly chart of the XRP/USD pair (data from Kraken).
- The pair may gain momentum if it surpasses the $1.500 resistance.
XRP Price Holds Gains Above $1.40
XRP price found support near the $1.30 zone and formed a base, initiating an upward movement similar to Bitcoin and Ethereum. It moved above the $1.3550 and $1.3750 resistance levels.
The break above the bearish trend line at $1.4580 allowed the pair to clear the $1.50 level, forming a high at $1.5238. The price is currently consolidating near the 23.6% Fibonacci retracement level of the move from the $1.2828 swing low to the $1.5238 high.
Trading above $1.45 and the 100-hourly Simple Moving Average suggests potential resistance near the $1.500 level, with major resistance at $1.5250.
Key resistance may occur at $1.550. A clear move above this level could target $1.5850, followed by potential gains toward $1.600 or $1.620. Major hurdles for the bulls are at $1.650 or $1.6550.
Another Decline?
If XRP does not clear the $1.500 resistance, a downside correction may begin. Initial support is near $1.4300, with major support at the $1.40 level, corresponding to the 50% Fibonacci retracement level of the upward move from the $1.2828 swing low to the $1.5238 high.
A decline below the $1.40 level could lead to further decreases toward the $1.3750 support, with additional support near the $1.350 zone.
Technical Indicators:
Hourly MACD: The MACD for XRP/USD is losing momentum in the bullish zone.
Hourly RSI: The RSI for XRP/USD is above the 50 level.
Major Support Levels: $1.4300 and $1.4000.
Major Resistance Levels: $1.5000 and $1.5250.
