Dec 19, 2025
6 0
XRP Price Dips Below $1.850 Amid Bearish Trend
XRP's price faced challenges, failing to maintain momentum above $1.920 and dropping below key levels.
- Price declined below the $1.850 zone, now trading under the 100-hourly Simple Moving Average.
- A bearish trend line is forming with resistance at $1.920 on the hourly chart.
- The pair could further decline if it settles below $1.780.
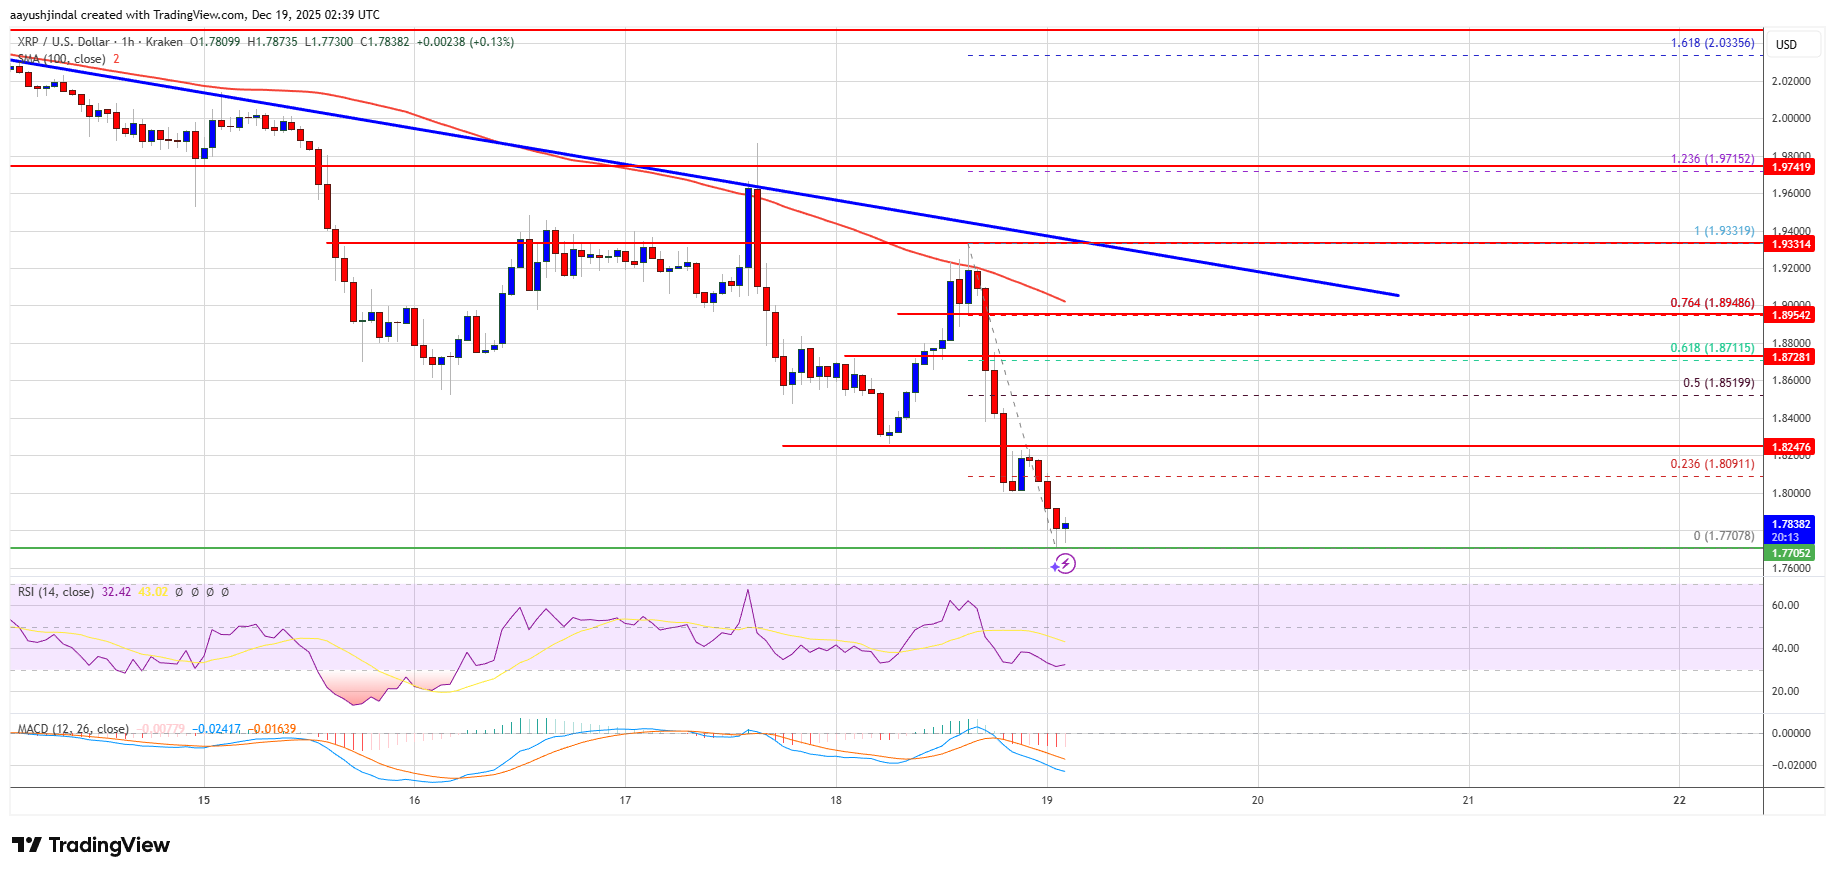
XRP Price Analysis
XRP attempted a recovery wave above $1.90 but failed as it started declining below $1.880 and $1.850. The price dipped below the $1.820 support level, reaching a low of $1.7707, showing bearish signals below the 23.6% Fib retracement level.
If XRP attempts an upward move, resistance is expected near $1.810, and major resistance around $1.8520 or the 50% Fib retracement level. A close above $1.8520 might push the price to $1.880. Further resistance is at $1.920; surpassing this could lead to $1.9650 and potentially $2.00, with a significant hurdle at $2.050.
Potential for More Losses
- If XRP fails to clear the $1.8520 resistance, it may experience further declines.
- Initial support is near $1.780, with major support at $1.7620.
- A break below $1.7620 could see the price drop toward $1.720, with further potential decline to $1.70 and $1.680.
Technical Indicators:
- Hourly MACD: Gaining pace in the bearish zone.
- Hourly RSI: Below the 50 level.
- Major Support Levels: $1.780 and $1.7620.
- Major Resistance Levels: $1.8520 and $1.920.