Dec 5, 2025
6 0
XRP Price Falls Below $2.10 Amid Bearish Trend and Resistance
XRP price experienced an increase above $2.120 but is now facing challenges to maintain a positive trend.
- XRP corrected downwards, testing the $2.080 level.
- Currently trading below $2.120 and the 100-hourly SMA.
- A bearish trend line shows resistance at $2.110 on the hourly XRP/USD chart from Kraken.
- Clearing the $2.150 resistance could initiate another upward move.
XRP Price Movements
The price dropped from the $2.220 zone, similar to movements in Bitcoin and Ethereum, falling below $2.20 and $2.150 into consolidation.
XRP fell past the 50% Fib retracement of its rise from $1.984 to $2.220, with resistance forming around $2.110. Despite this, support held above $2.080.
Trading below $2.10 and the 100-hourly SMA, the price faces resistance near $2.110.
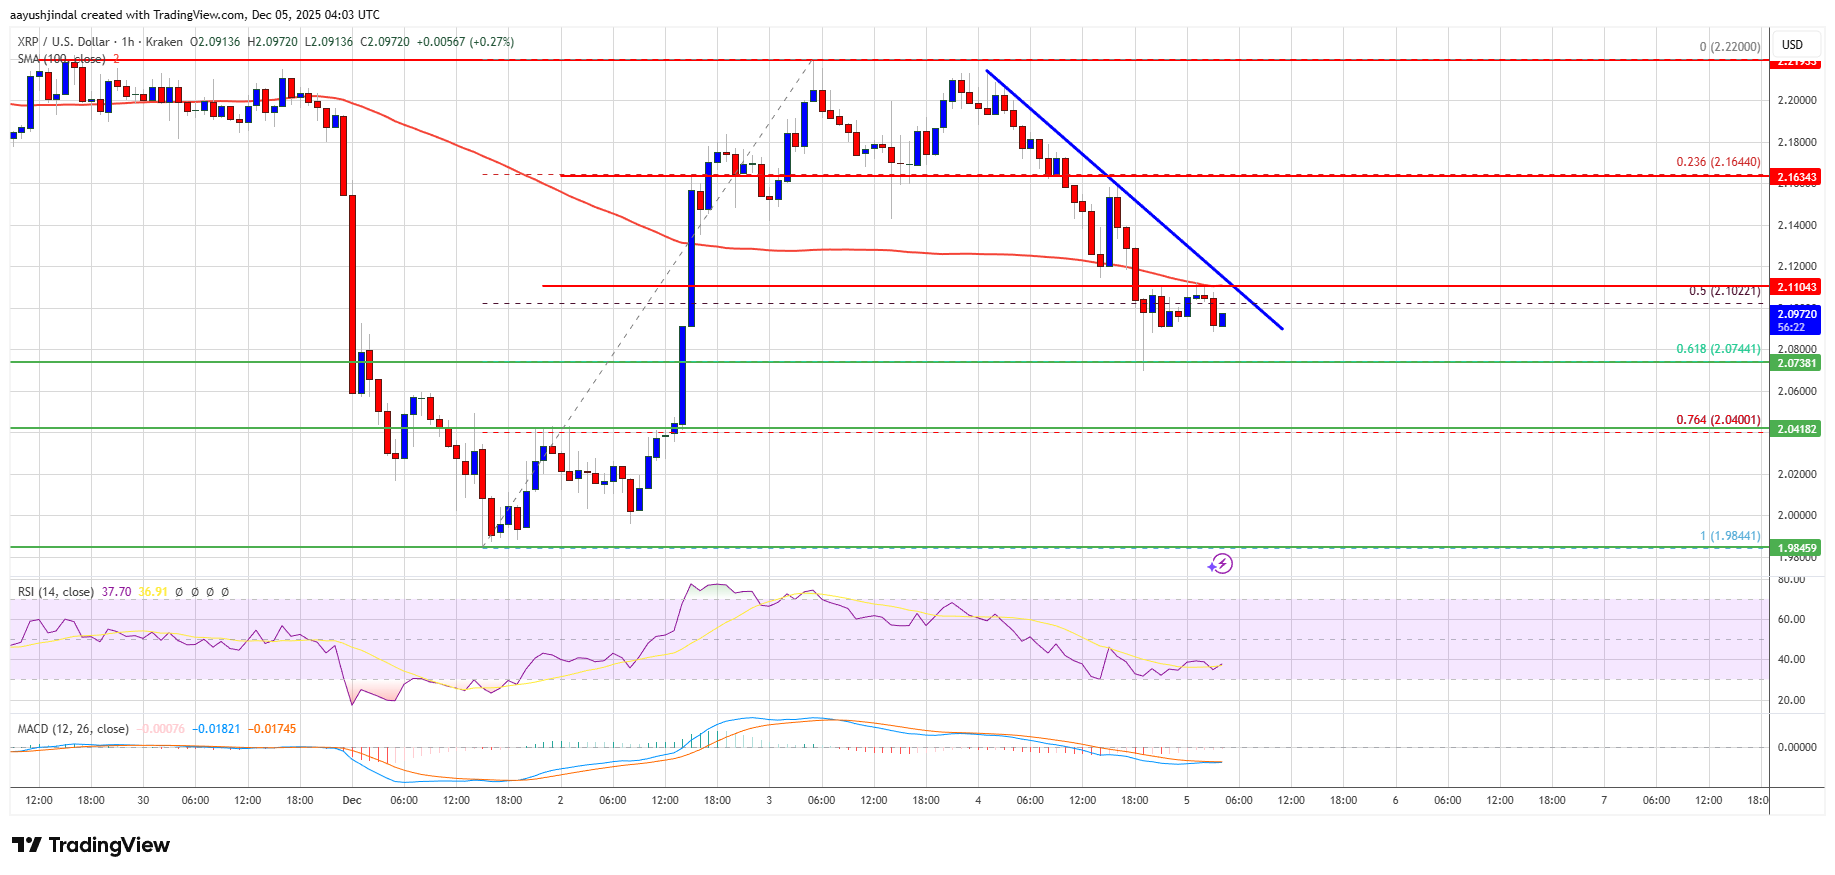
- Major resistance lies at $2.150; surpassing it could lead to testing $2.220.
- A breakthrough of $2.220 might push the price towards $2.2850, with further gains potentially reaching $2.350.
- The next significant hurdle for bulls is around $2.420.
Potential Decline?
- If XRP can't clear the $2.150 zone, a decline may occur.
- Initial support is at $2.080, aligning with the 61.8% Fib retracement from $1.984 to $2.220.
- Further support is seen at $2.040; breaking below could lead to a drop towards $2.00.
- An extended decline might target $1.9850 and then $1.920.
Technical Indicators:
Hourly MACD: Increasing pace in the bearish zone.
Hourly RSI: Below 50.
Major Support Levels: $2.080, $2.040.
Major Resistance Levels: $2.110, $2.150.