Nov 21, 2025
7 0
XRP Price Decline Continues Below $2.0 Facing Resistance at $2.080
XRP Price Analysis
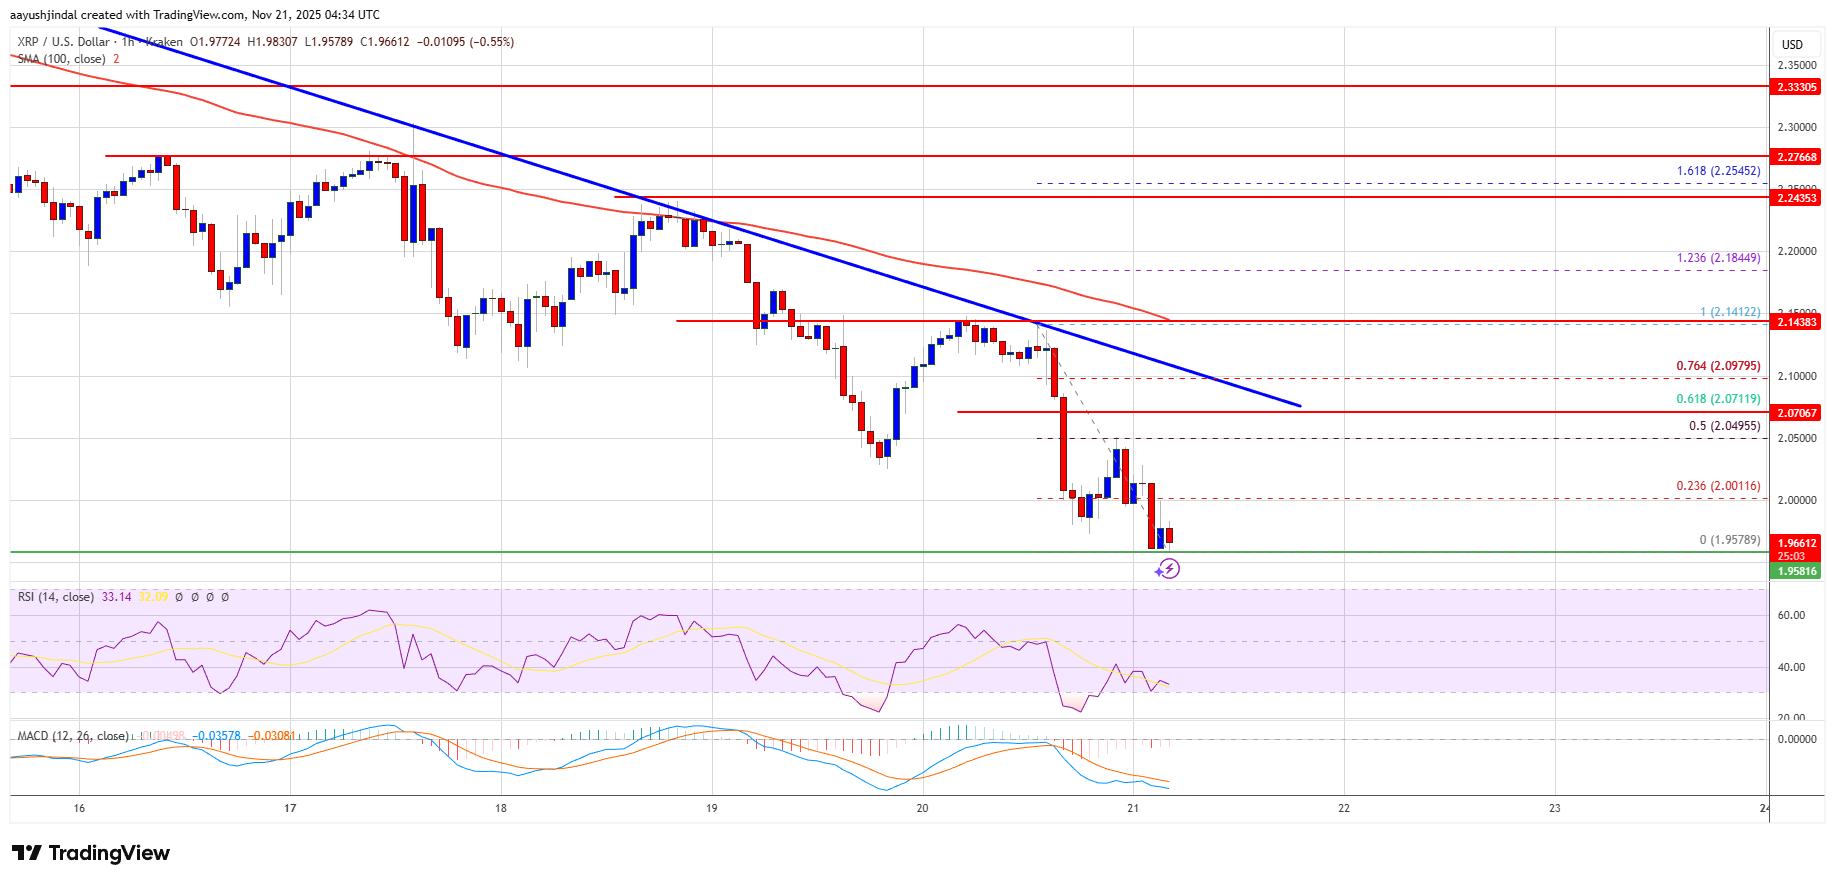
- XRP price is declining and now trades below the $2.050 level and the 100-hourly Simple Moving Average.
- A bearish trend line with resistance at $2.080 is forming on the hourly chart of the XRP/USD pair.
- The price attempted to recover above $2.120 but failed, continuing its decline below $2.050 and $2.020.
- A low was recorded at $1.957, with consolidation below the 23.6% Fibonacci retracement level from the $2.141 swing high to the $1.9575 low.
- The first major resistance is near the $2.080 level, and a break above could lead to further gains toward $2.120 and potentially $2.150.
- If the price fails to overcome the $2.080 resistance, it may decline further, with initial support at $1.950 and major support at $1.920.
- A break below $1.920 could push the price toward $1.880 and possibly $1.8450 or lower.
Technical Indicators
- Hourly MACD: Gaining pace in the bearish zone.
- Hourly RSI: Below the 50 level, indicating bearish momentum.
- Major Support Levels: $1.950 and $1.920.
- Major Resistance Levels: $2.050 and $2.080.