XRP Price Fades After Rallying Toward $0.5780 Resistance
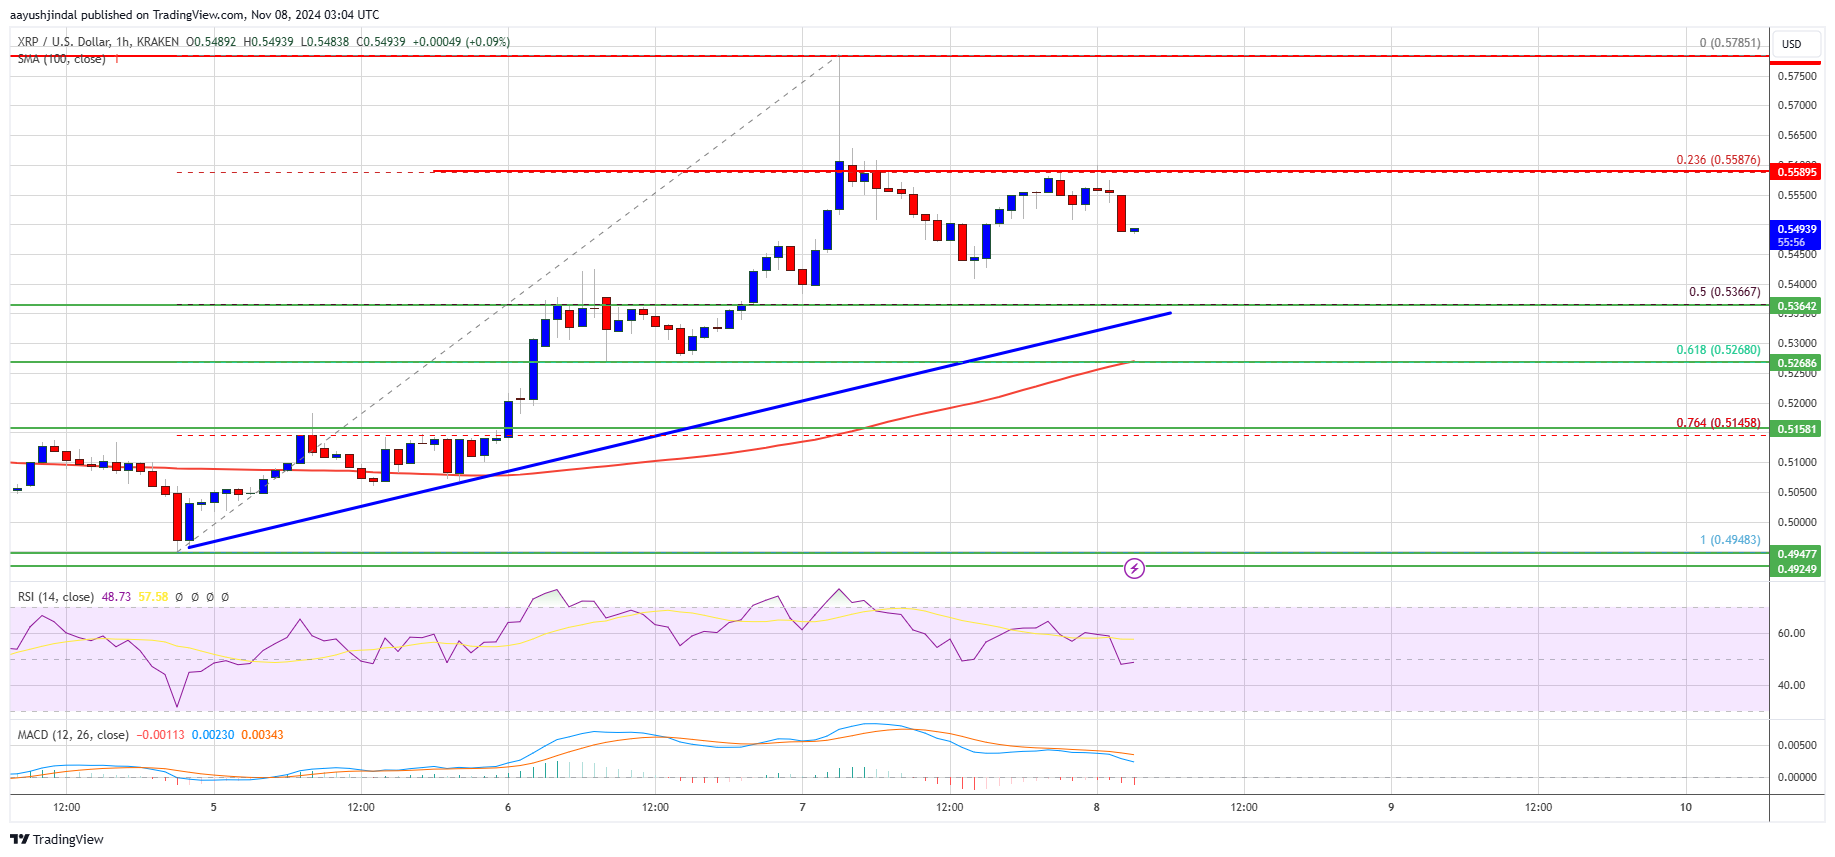
XRP price increased, moving above the $0.5500 support zone but later experienced a decline after reaching $0.5780 resistance.
- XRP price is losing momentum above the $0.5500 zone.
- Current trading occurs above $0.5320 and the 100-hourly Simple Moving Average.
- A key bullish trend line is forming with support at $0.5360 on the hourly chart of the XRP/USD pair (data from Kraken).
- The pair may initiate a fresh increase if it remains above the $0.5250 support zone.
XRP Price Potential for Upside
XRP price has established support above $0.5150, allowing for an increase past $0.5250, similar to movements in Bitcoin and Ethereum. The price surpassed the $0.5350 and $0.5500 resistance levels, peaking at $0.5758 before correcting.
The price fell below the 23.6% Fib retracement level of the upward move from the $0.4948 swing low to the $0.5758 high. It currently trades above $0.5320 and the 100-hourly Simple Moving Average, supported by a bullish trend line near the 50% Fib retracement level.
Resistance is expected near $0.5600, followed by $0.5650. A breakout above $0.5780 could lead to a rise toward $0.5880. Further gains may push the price towards $0.5920 or $0.6000, with a significant barrier at $0.6200.
Potential for Decline
If XRP does not surpass the $0.5650 resistance, it may continue to decline. Initial support is near $0.5450, with major support at $0.5360 and the trend line.
A close below the $0.5360 level may result in further declines toward $0.5250, with subsequent major support around $0.5120.
Technical Indicators
Hourly MACD – The MACD for XRP/USD is losing momentum in the bullish zone.
Hourly RSI (Relative Strength Index) – The RSI for XRP/USD is below the 50 level.
Major Support Levels – $0.5450 and $0.5360.
Major Resistance Levels – $0.5600 and $0.5650.
