BULLISH 📈 : XRP price maintains momentum as traders anticipate breakout rally
XRP's price attempted to surpass $1.4320 but started a downside correction, now holding support at $1.3550.
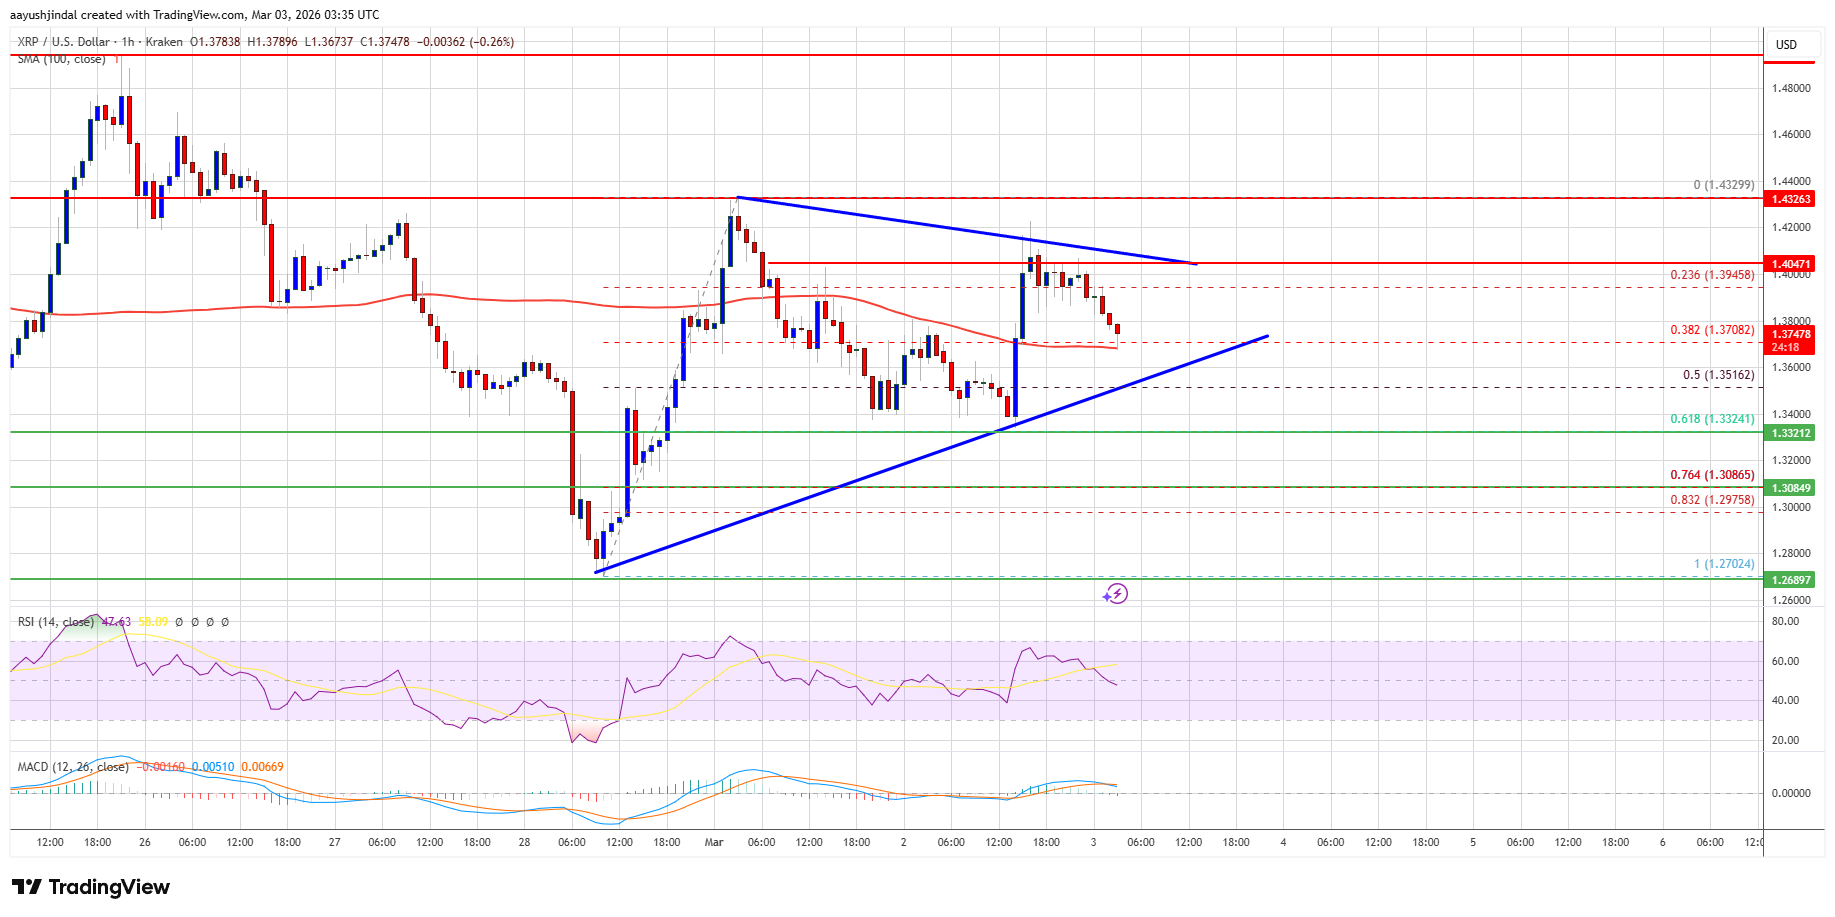
- XRP declined below $1.40 but remains above $1.370 and the 100-hourly Simple Moving Average.
- A contracting triangle is forming with resistance at $1.4080 on the hourly chart of the XRP/USD pair.
- The pair may rise again if it maintains above $1.350.
XRP Price Dynamics
XRP fell below $1.420, entering a negative zone after dipping under $1.4050 and $1.40. The price breached the 23.6% Fib retracement level from $1.2702 to $1.4329.
Bulls are active above $1.3650, keeping the price above $1.370 and the 100-hourly SMA. A new upward move could face resistance at $1.4050 and the triangle’s trend line, with major resistance at $1.4320.
A clear break above $1.450 may push the price toward $1.50, with further gains potentially targeting $1.520 and $1.550.
Potential Downside
If XRP cannot clear $1.4050 resistance, it might decline. Initial support lies at $1.370, followed by major support at $1.3515 (50% Fib retracement level). Breaching $1.3515 could see a decline to $1.3080, with additional support near $1.2850 and possibly down to $1.2620.
Technical Indicators
- Hourly MACD: Losing pace in the bullish zone.
- Hourly RSI: Below the 50 level.
- Major Support Levels: $1.370 and $1.3515.
- Major Resistance Levels: $1.4050 and $1.4320.