Dec 4, 2025
10 0
XRP Price Approaches Key Resistance with Potential for Further Gains
XRP Price Analysis
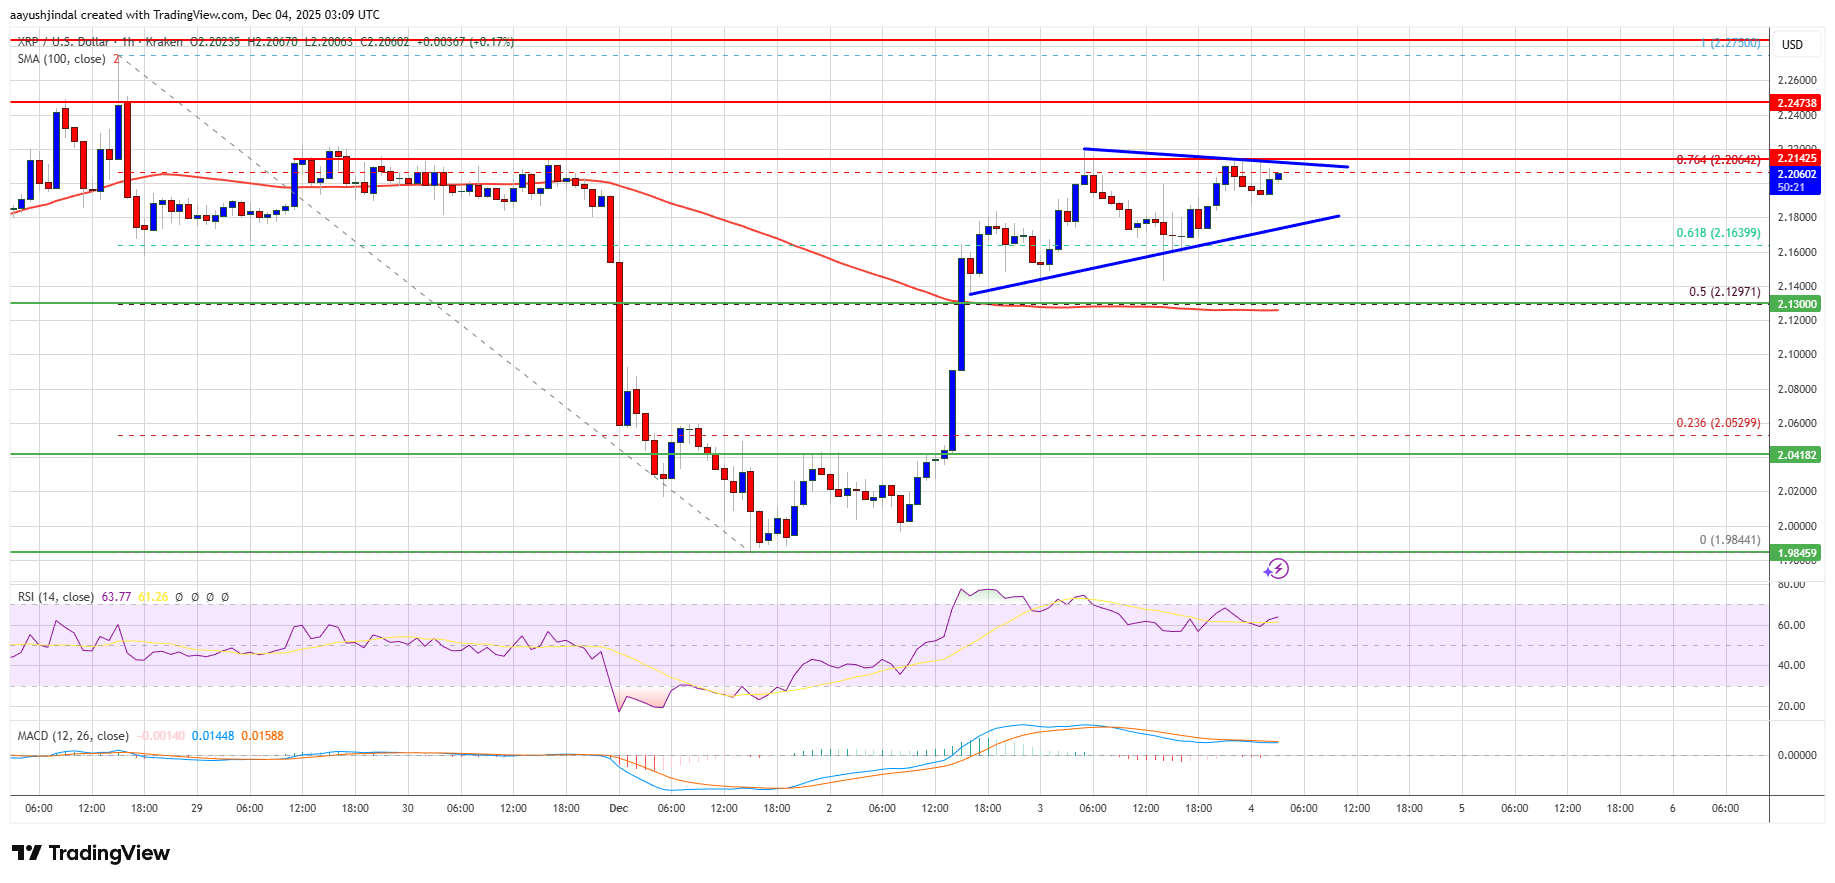
- XRP is in a recovery phase, trading above $2.150 and the 100-hourly Simple Moving Average.
- A short-term contracting triangle has formed with resistance at $2.20 on the XRP/USD hourly chart.
- Key resistance levels are at $2.220 and $2.250; breaking these could push the price to $2.350 or higher.
- If unable to surpass $2.250, XRP may decline, with support at $2.180 and $2.150.
- Further declines might lead to $2.10 and then $2.00.
Technical Indicators
- MACD for XRP/USD is showing bullish momentum.
- RSI for XRP/USD is above 50, indicating potential upward movement.
- Support levels: $2.180 and $2.150.
- Resistance levels: $2.220 and $2.250.