XRP Price Faces Resistance at $2.00 Amid Recovery Efforts
XRP Price Overview
- XRP has initiated a recovery wave, moving above the $1.9050 zone.
- The price is trading below $2.00 and the 100-hourly Simple Moving Average (SMA).
- A bearish trend line shows resistance at $1.9520 on the hourly XRP/USD chart.
- Breaking above $2.00 could lead to further upward movement.
XRP Price Faces Resistance
The XRP price found support above $1.850 and started recovering, similar to Bitcoin and Ethereum. It climbed above $1.880 and $1.90 but encountered resistance near $1.950. A bearish trend line forms resistance at $1.9520.
Currently, XRP trades below $1.950 and the 100-hourly SMA. Any upward movement may face resistance around $1.950 and aligns with the 50% Fibonacci retracement level from the $2.047 high to the $1.850 low.
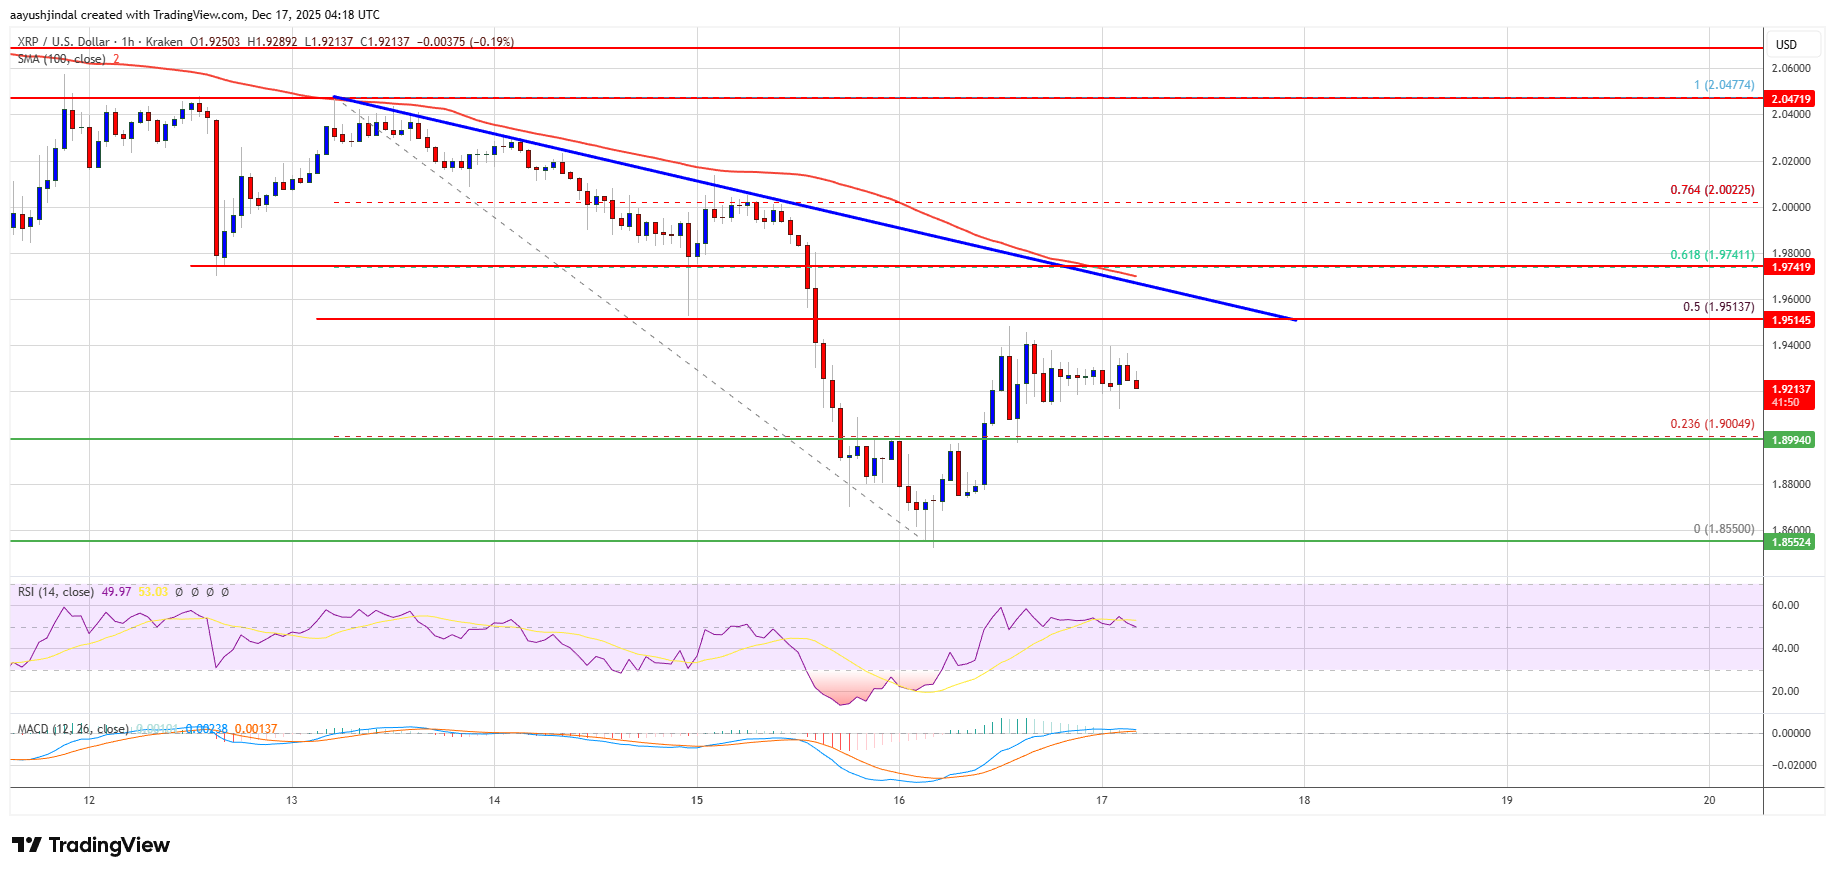
Resistance levels are identified at $2.00, $2.050, and $2.120, with potential targets at $2.20 and $2.250 if surpassed.
Potential Decline
If XRP fails to overcome the $2.00 resistance, it might decline. Initial support is at $1.90, with significant support at $1.850. A break below $1.850 could lead to further decline toward $1.820 and potentially $1.7650.
Technical Indicators
- Hourly MACD: Losing momentum in the bearish zone.
- Hourly RSI: Above the 50 level, indicating some bullish sentiment.
- Major Support Levels: $1.90 and $1.850.
- Major Resistance Levels: $1.950 and $2.00.