BEARISH 📉 : XRP price declines, struggles to maintain support above $1.450
XRP's price recently failed to surpass $1.680 and started a decline, now correcting gains and possibly struggling to maintain above $1.450.
- XRP declined below $1.550, trading above $1.450 and the 100-hourly Simple Moving Average.
- A break occurred below a bullish trend line with support at $1.4880 on the hourly XRP/USD chart.
- The price might rise again if it remains above $1.440.
Current Price Movement
XRP's price failed to hold above $1.620, initiating a downside correction similar to Bitcoin and Ethereum. It fell below $1.60 and $1.550, entering a negative zone.
The price dipped below the 61.8% Fib retracement level of the upward move from $1.3475 to $1.6713. A break below a key bullish trend line was observed at $1.4880 support.
Bulls are active above $1.450, with current trading above $1.4620 and the 100-hourly SMA. If an upward move occurs, resistance may be encountered near $1.50, then $1.510, potentially testing $1.5450.
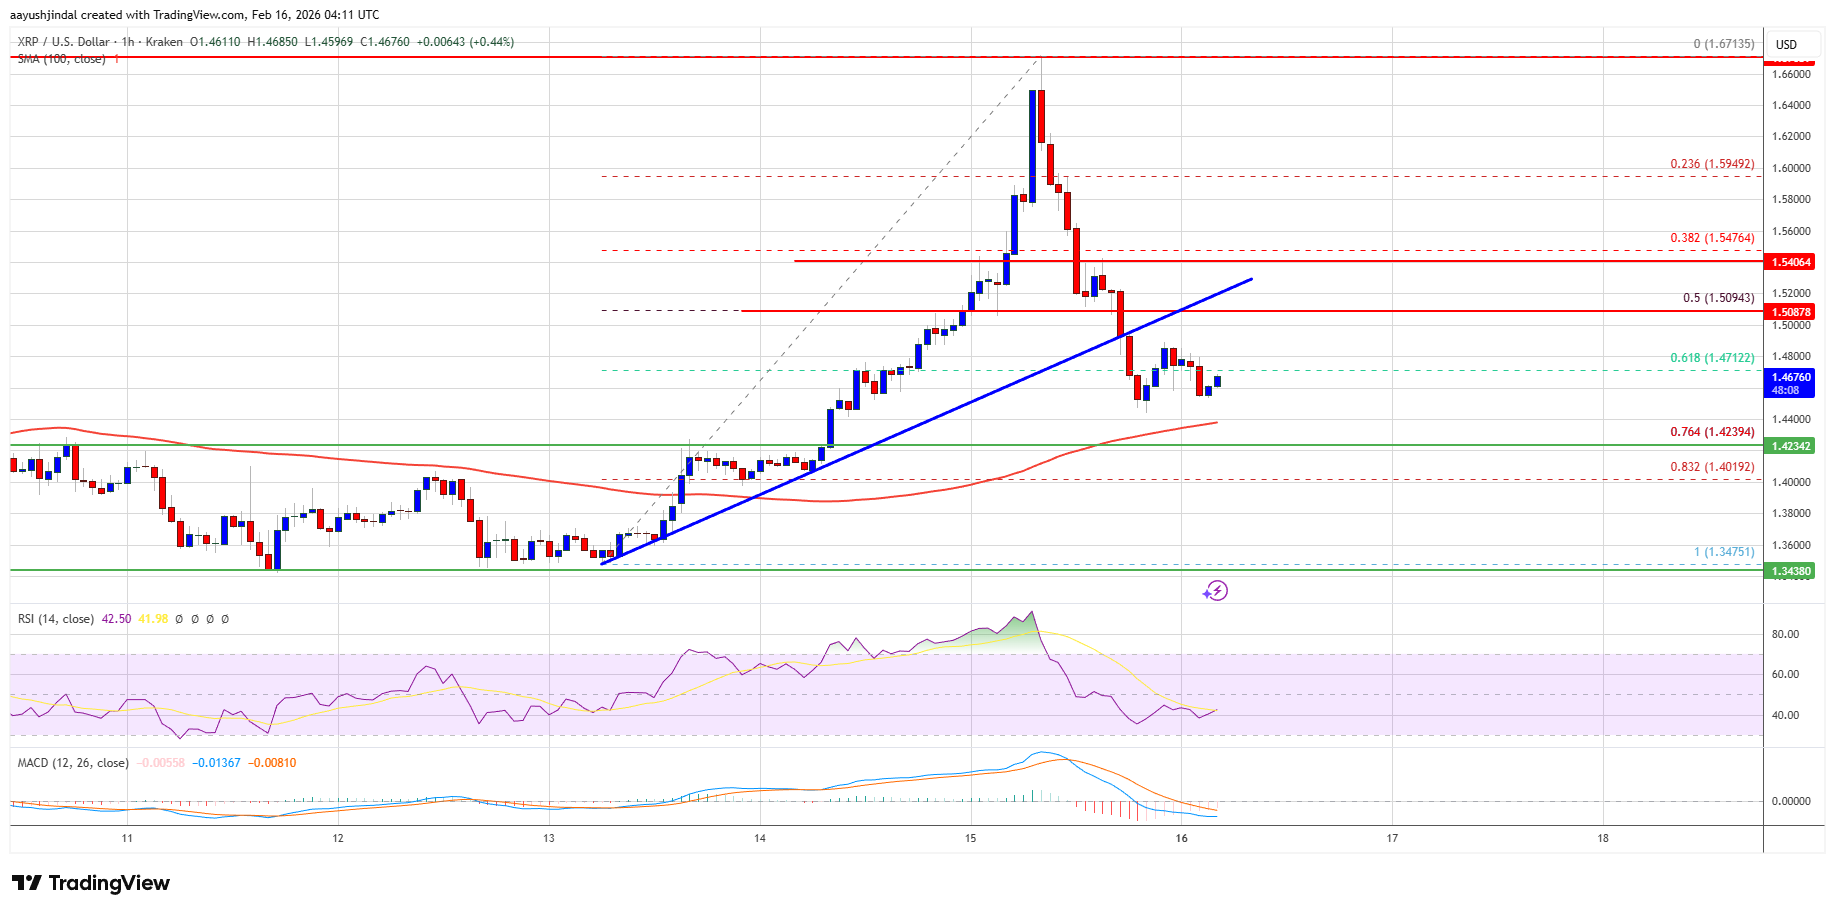
Surpassing $1.5450 could push the price towards $1.580 and $1.620 resistances. The next hurdle is around $1.640.
Potential Downside
- If XRP fails at $1.510, a decline could start with initial support at $1.440.
- Next major support lies at $1.4240 or the 76.4% Fib retracement level.
- A break below $1.4240 might lead to further decline toward $1.40 and possibly $1.360.
Technical Indicators:
- Hourly MACD: Gaining pace in the bearish zone.
- Hourly RSI: Below 50 level.
- Major Support Levels: $1.440 and $1.4240.
- Major Resistance Levels: $1.50 and $1.510.