Jan 21, 2026
1 0
XRP Price Struggles Below $2.00 Amid Bearish Trend
XRP Price Analysis
- XRP price has declined below $1.950 and is trading under the 100-hourly Simple Moving Average.
- A bearish trend line with resistance at $2.00 is forming on the hourly chart.
- The price experienced a drop below $1.880, reaching a low of $1.8681 before consolidating.
- Currently, XRP is facing resistance near $1.950, which corresponds to the 50% Fib retracement level from the recent high of $2.028.
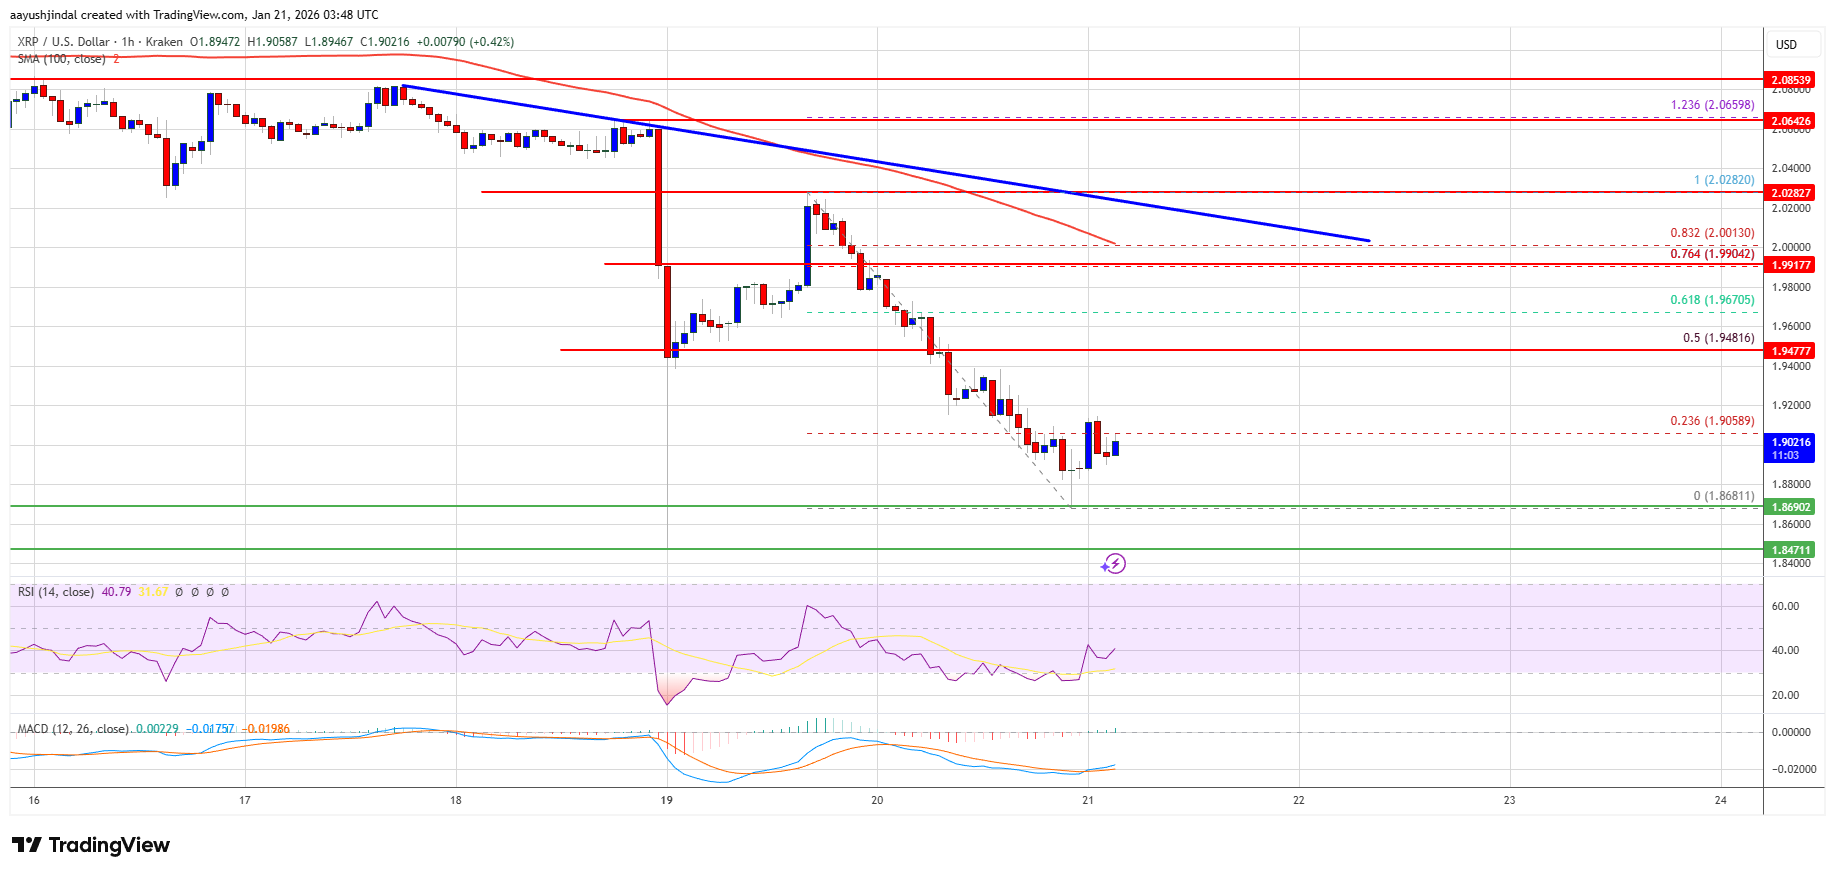
- Main resistance levels are identified at $2.00, $2.050, and $2.10. Breaking these could push the price to $2.120 or higher.
- If XRP fails to break above $1.95, it may decline further, with support at $1.880 and $1.850.
- A break below $1.850 could lead to a continued decline toward $1.820 and possibly $1.7650.
Technical Indicators
- Hourly MACD: Gaining pace in the bearish zone.
- Hourly RSI: Below the 50 level.
- Support Levels: $1.880 and $1.850.
- Resistance Levels: $1.950 and $2.00.