XRP Price Targets Breakout Above $1.60 as Momentum Increases
XRP price is rising above the $1.480 zone, with indications of a potential breakout above the $1.60 level.
- XRP price aims for an increase above the $1.5850 resistance zone.
- The price is trading above $1.520 and the 100-hourly Simple Moving Average.
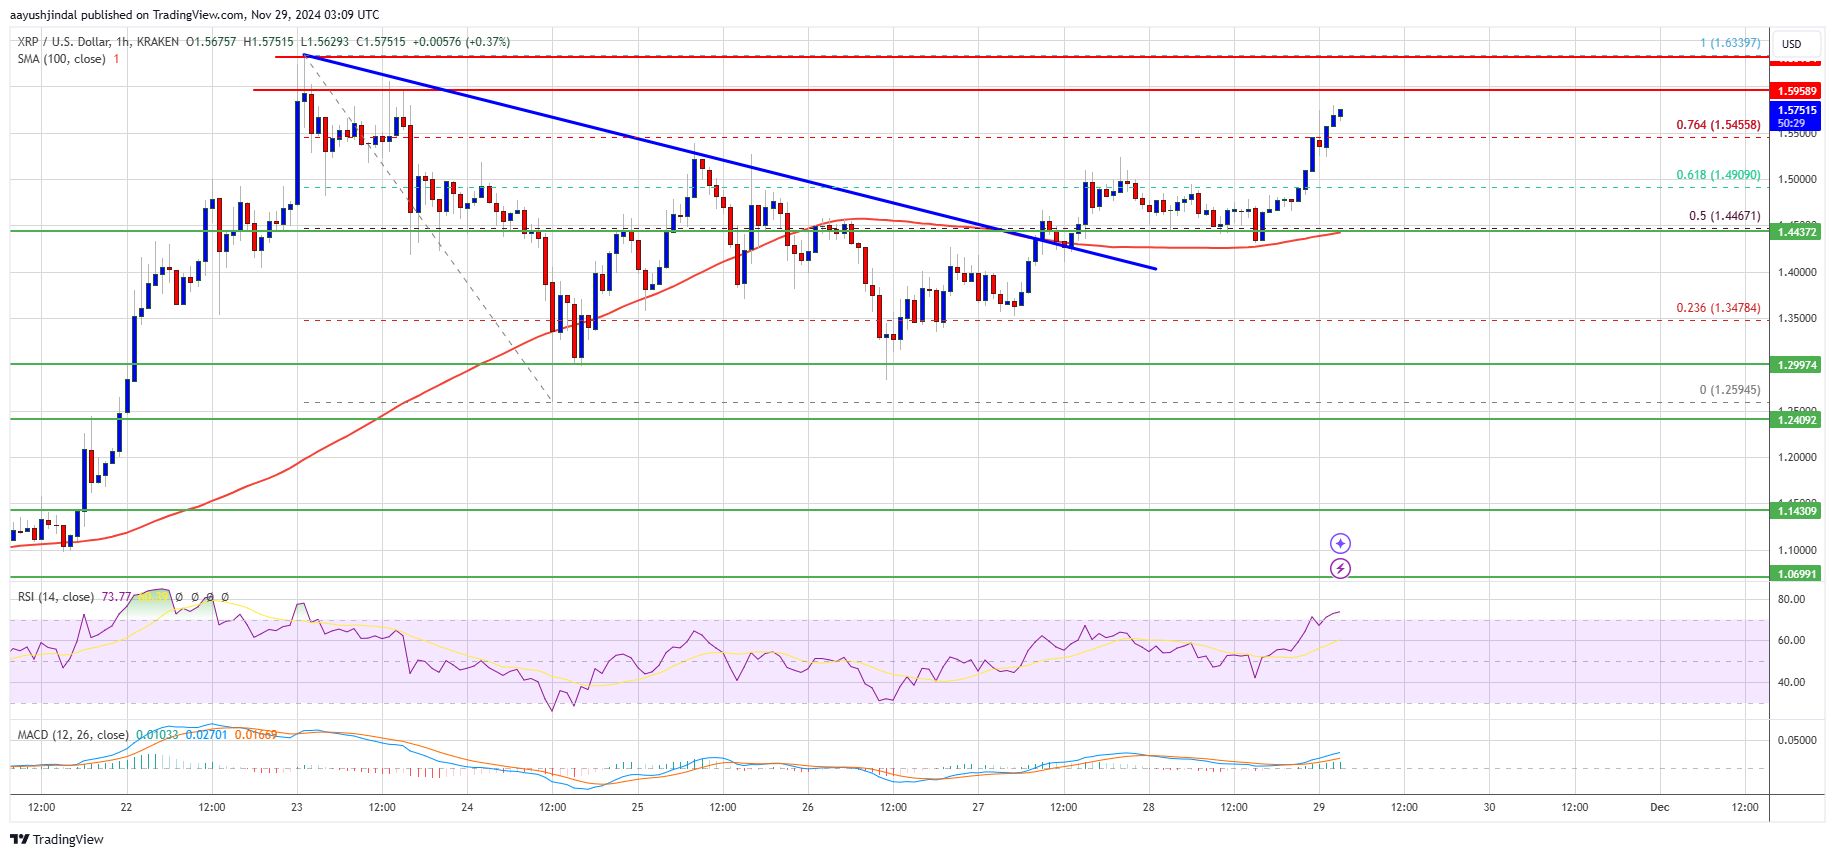
- A key bearish trend line was broken at $1.4450 on the hourly chart of the XRP/USD pair (data source from Kraken).
- The pair may gain momentum if it clears the $1.600 resistance.
XRP Price Movement Above $1.50
XRP price found support near the $1.400 zone and started an upward move, similar to Bitcoin and Ethereum. It surpassed the $1.420 and $1.4350 resistance levels.
The break above the $1.4450 trend line allowed the price to clear the $1.50 level and move above the 61.8% Fibonacci retracement level from the $1.6339 swing high to the $1.2594 low.
Currently, the price trades above $1.50 and the 100-hourly Simple Moving Average, also above the 76.4% Fibonacci retracement level.
On the upside, resistance may occur near $1.5850, with major resistance at $1.600. A clear move above $1.6350 could push the price toward $1.6650, with further increases targeting $1.680 or even $1.6920. The ultimate hurdle for bulls is $1.70.
Potential Pullback
If XRP does not clear the $1.600 resistance, a downside correction may begin. Initial support is around $1.500, followed by significant support near $1.480.
A decline below the $1.480 level might lead to further drops toward $1.4550, with major support sitting near the $1.400 zone.
Technical Indicators
Hourly MACD – The MACD for XRP/USD is gaining momentum in the bullish zone.
Hourly RSI (Relative Strength Index) – The RSI for XRP/USD is above the 50 level.
Major Support Levels – $1.5000 and $1.4800.
Major Resistance Levels – $1.6000 and $1.6350.
