XRP Forms Spinning Bottom Pattern Amid BTC Breaks Key Trendline
XRP Analysis
XRP formed a "spinning bottom" candlestick pattern on Monday, indicating active trading without a clear winner among buyers and sellers. This pattern emerged after a 25% price drop from the July peak of $3.65, near a key support level around the August 3 low.

The spinning bottom suggests potential waning selling pressure, but confirmation is needed through subsequent price action. Key points include:
- XRP currently priced at $2.80, with focus on Monday's high of $2.84
- Support levels: $2.69 (Monday's low), $2.65 (May swing high), $2.48 (200-day SMA)
- Resistance levels: $2.84 (Monday's high), $3.38 (August high), $3.65 (July high)
Despite this, the 5- and 10-day moving averages show downward trends, indicating continued bearish momentum. A breach below $2.69 may lead to further declines.
Bitcoin Analysis
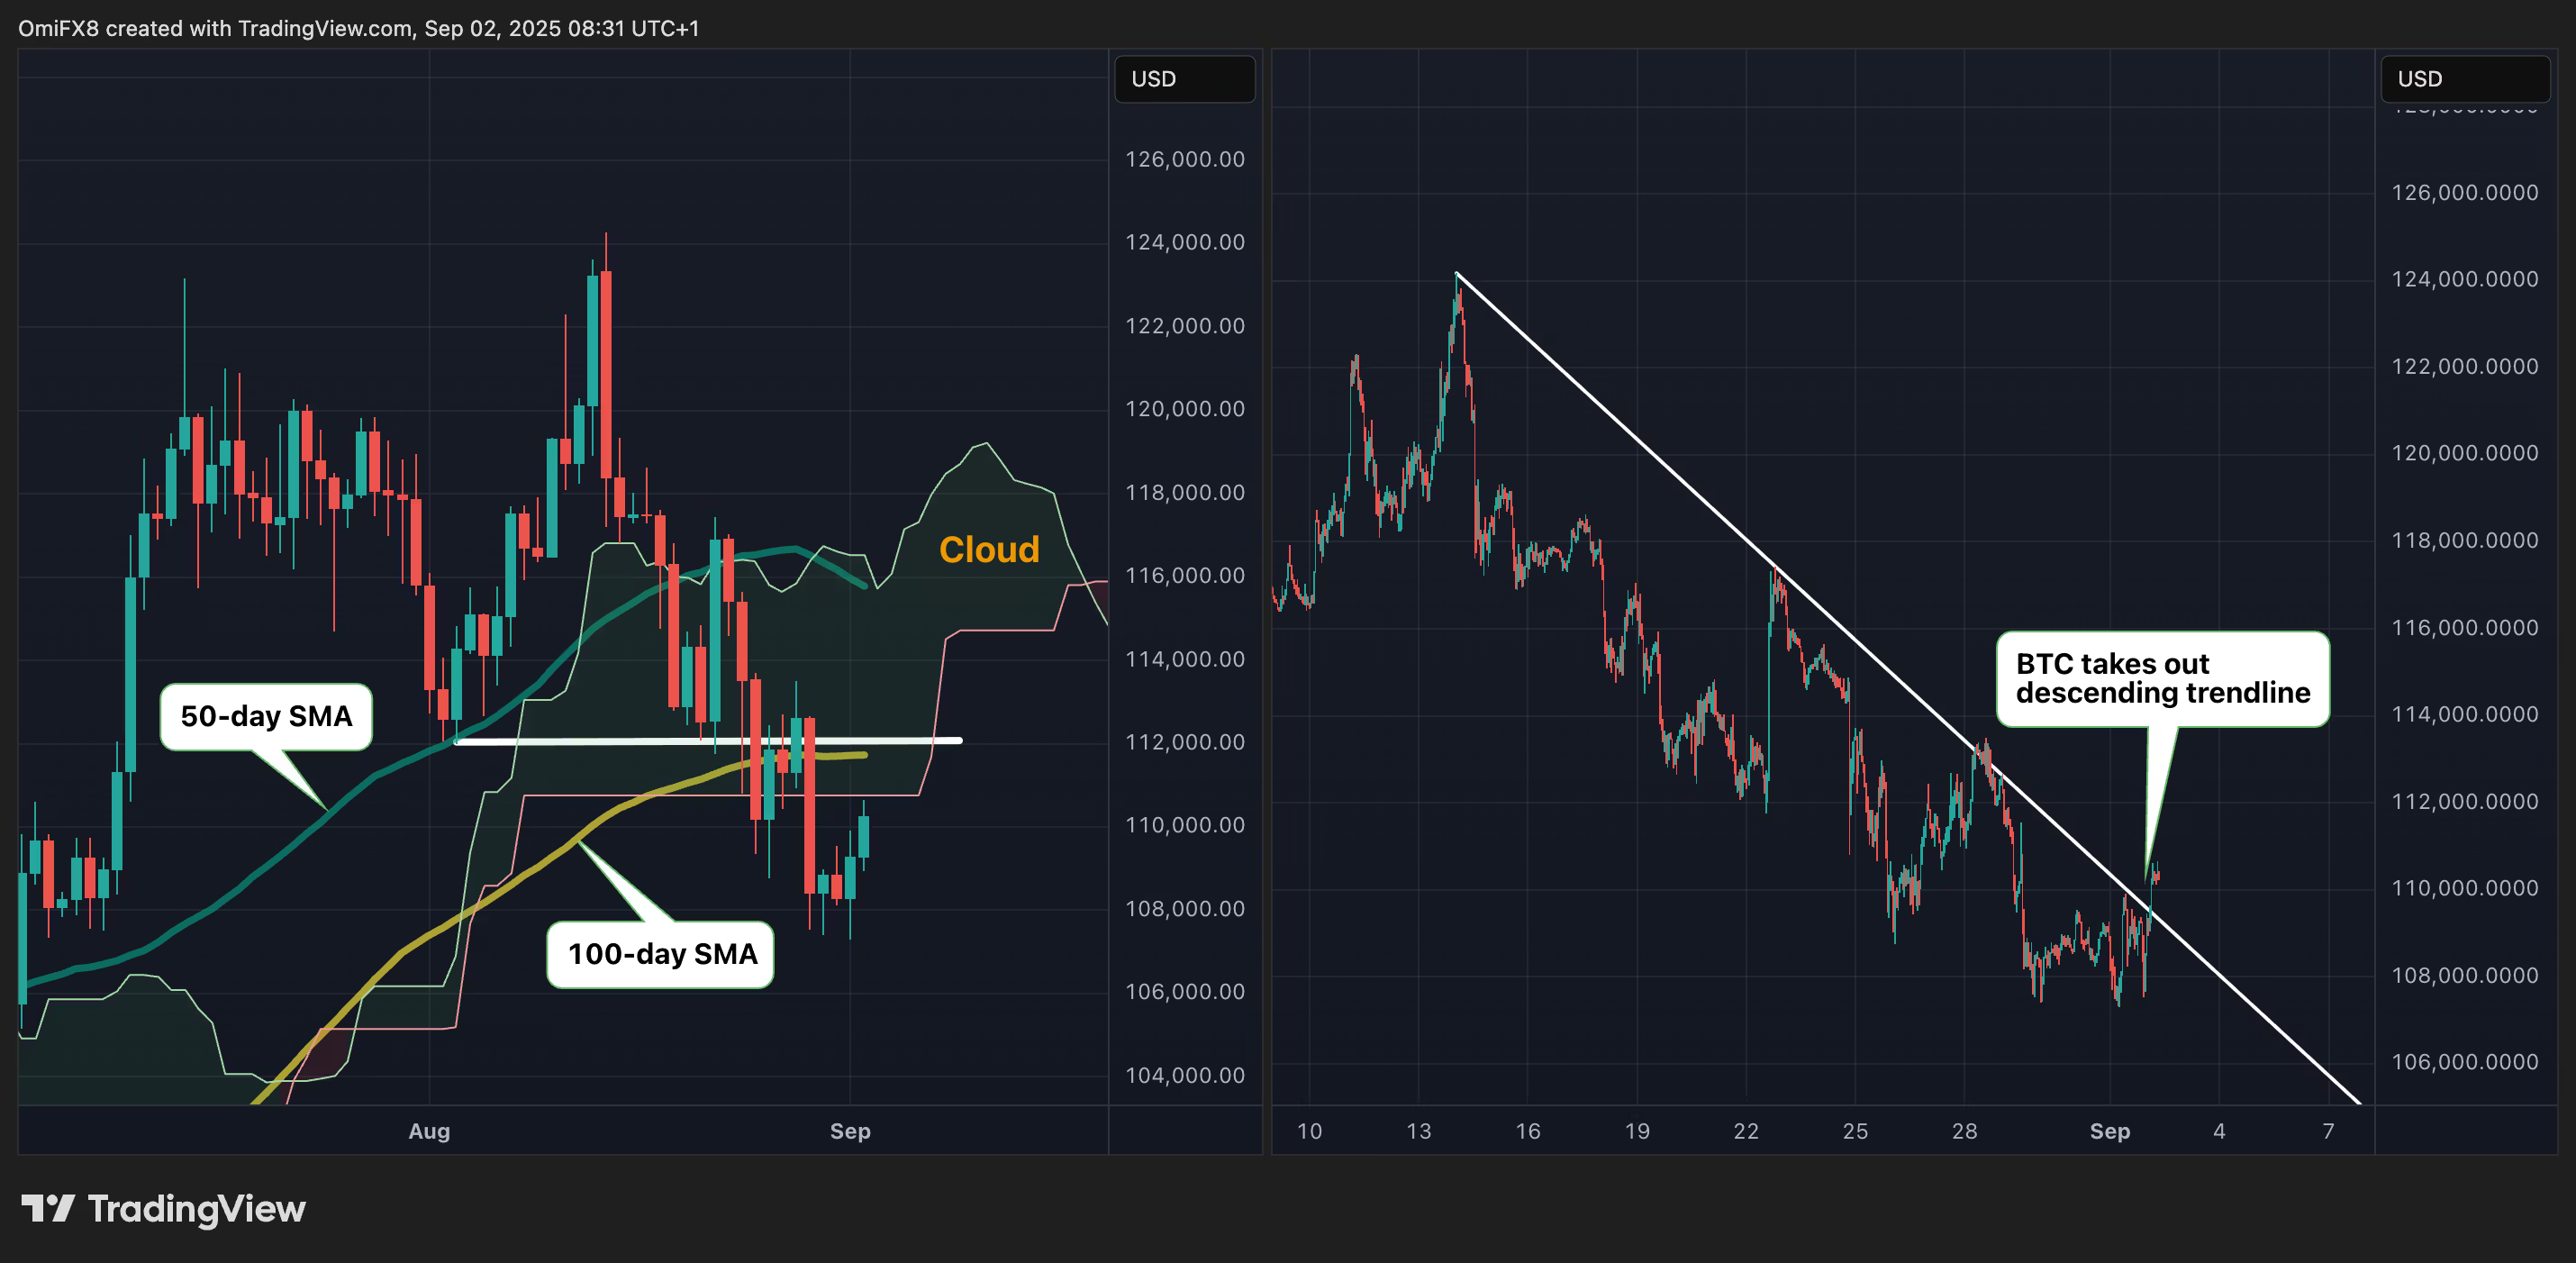
BTC surpassed a descending trendline following a pullback from highs above $124,000. However, prices remain below critical resistance levels, including the Ichimoku cloud and moving averages, indicating a bearish outlook.

Key points include:
- Support levels: $107,286 (Monday's low), $100,000, $98,330 (June swing low)
- Resistance levels: $110,756 (Ichimoku cloud), $111,728 (100-day SMA), $115,780 (50-day SMA)
A sustained move above the Ichimoku cloud is necessary to negate the current bearish sentiment.