Feb 20, 2026
3 0
BEARISH 📉 : Dogecoin struggles below $0.10 amid bearish trend continuation
Dogecoin (DOGE) Analysis
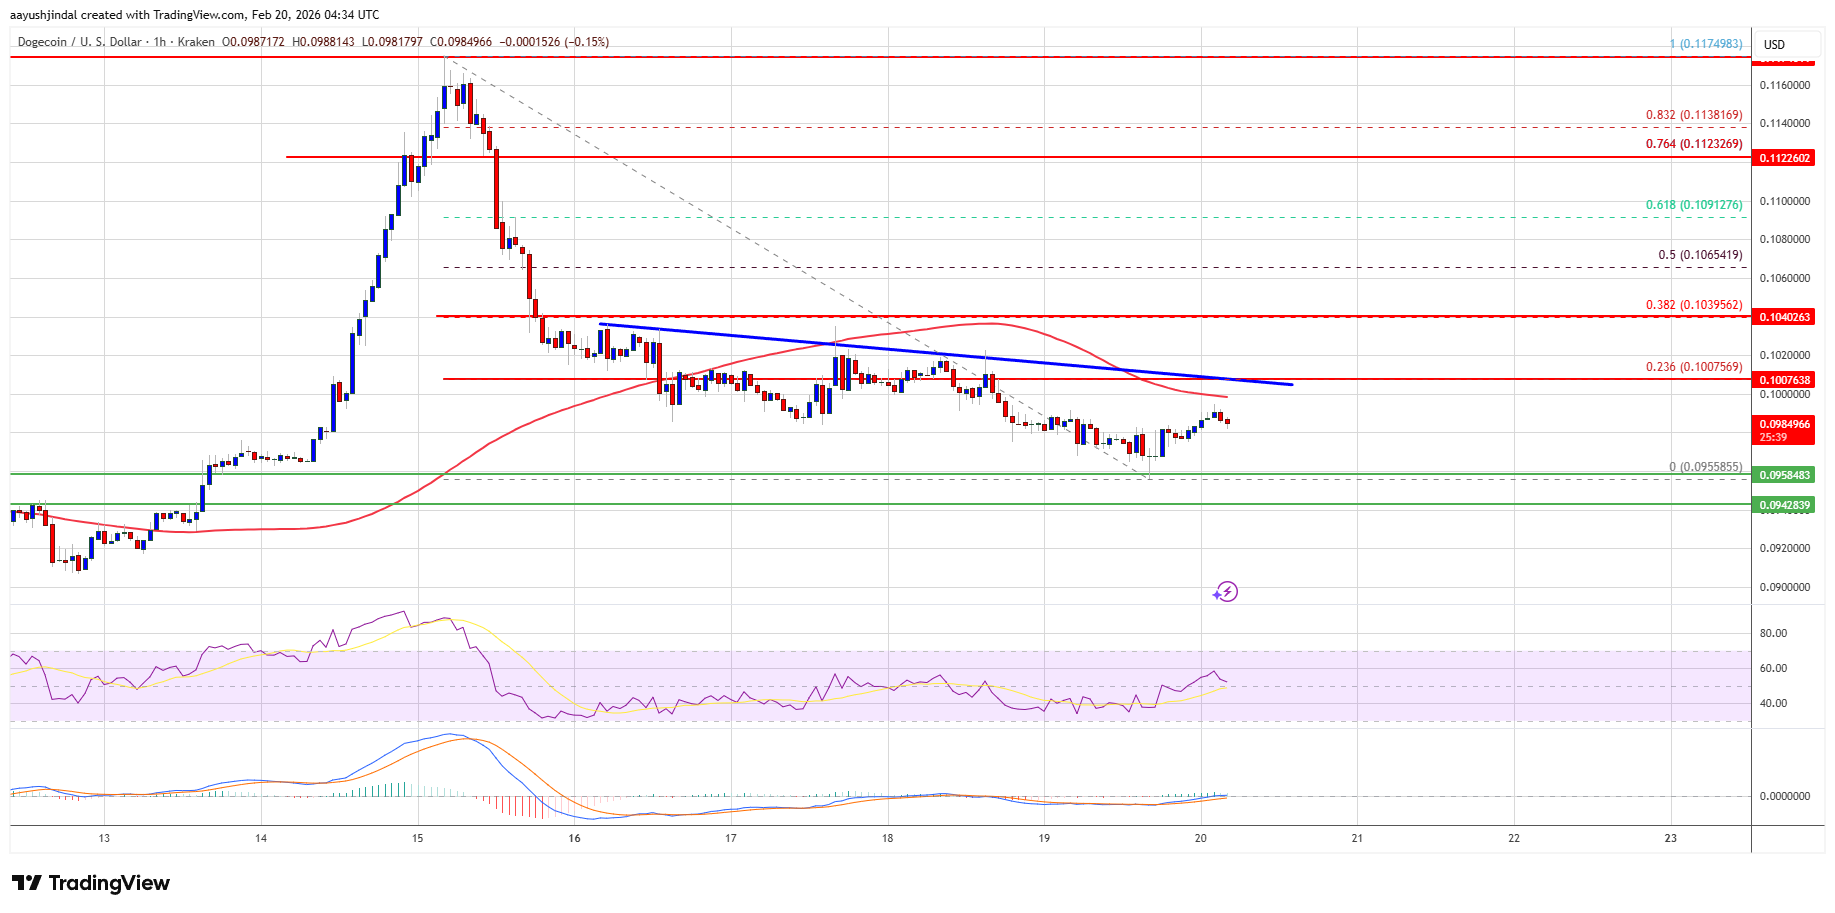
- DOGE is trading below the $0.10 level and the 100-hourly simple moving average.
- A key bearish trend line with resistance at $0.1005 is forming on the hourly chart of the DOGE/USD pair.
- The price could extend losses if it remains below $0.1020 and $0.1040.
Current Price Movement
- DOGE declined below $0.1050, closing below the $0.1040 and $0.1020 support levels.
- A recent low was set near $0.0955, with a slight recovery above $0.0980.
- The price remains under the 23.6% Fib retracement level from the $0.1174 high to the $0.0955 low.
Potential Recovery and Resistance Levels
- Immediate resistance is near $0.10, leading up to major resistance at $0.1005 and $0.1040.
- A close above $0.1040 might push the price towards $0.1065, with potential further gains to $0.1120 and $0.1150.
Downside Risks
- If DOGE fails to rise above $0.1040, it may continue to decline.
- Initial support is at $0.0955, with significant support levels at $0.0920 and $0.0880.
- A break below $0.0880 could lead to declines toward $0.0832 or $0.0820.
Technical Indicators
- Hourly MACD indicates momentum in the bearish zone.
- Hourly RSI is below the 50 level.
- Major support levels are $0.0955 and $0.0920; resistance levels are $0.1005 and $0.1040.