2 0
Six Charts Indicate Bitcoin’s Rise Above $100K May Be More Stable
Bitcoin is trading above $100,000, raising concerns among investors about a potential repeat of the previous price decline. However, current market conditions suggest a stronger basis for continued upward movement.
Financial conditions
- U.S. dollar index at 99.60, down 9% from January highs.
- 10-year Treasury yield at 4.52%, down 30 basis points from January's high.
- 30-year yield above 5%, perceived positively for Bitcoin.

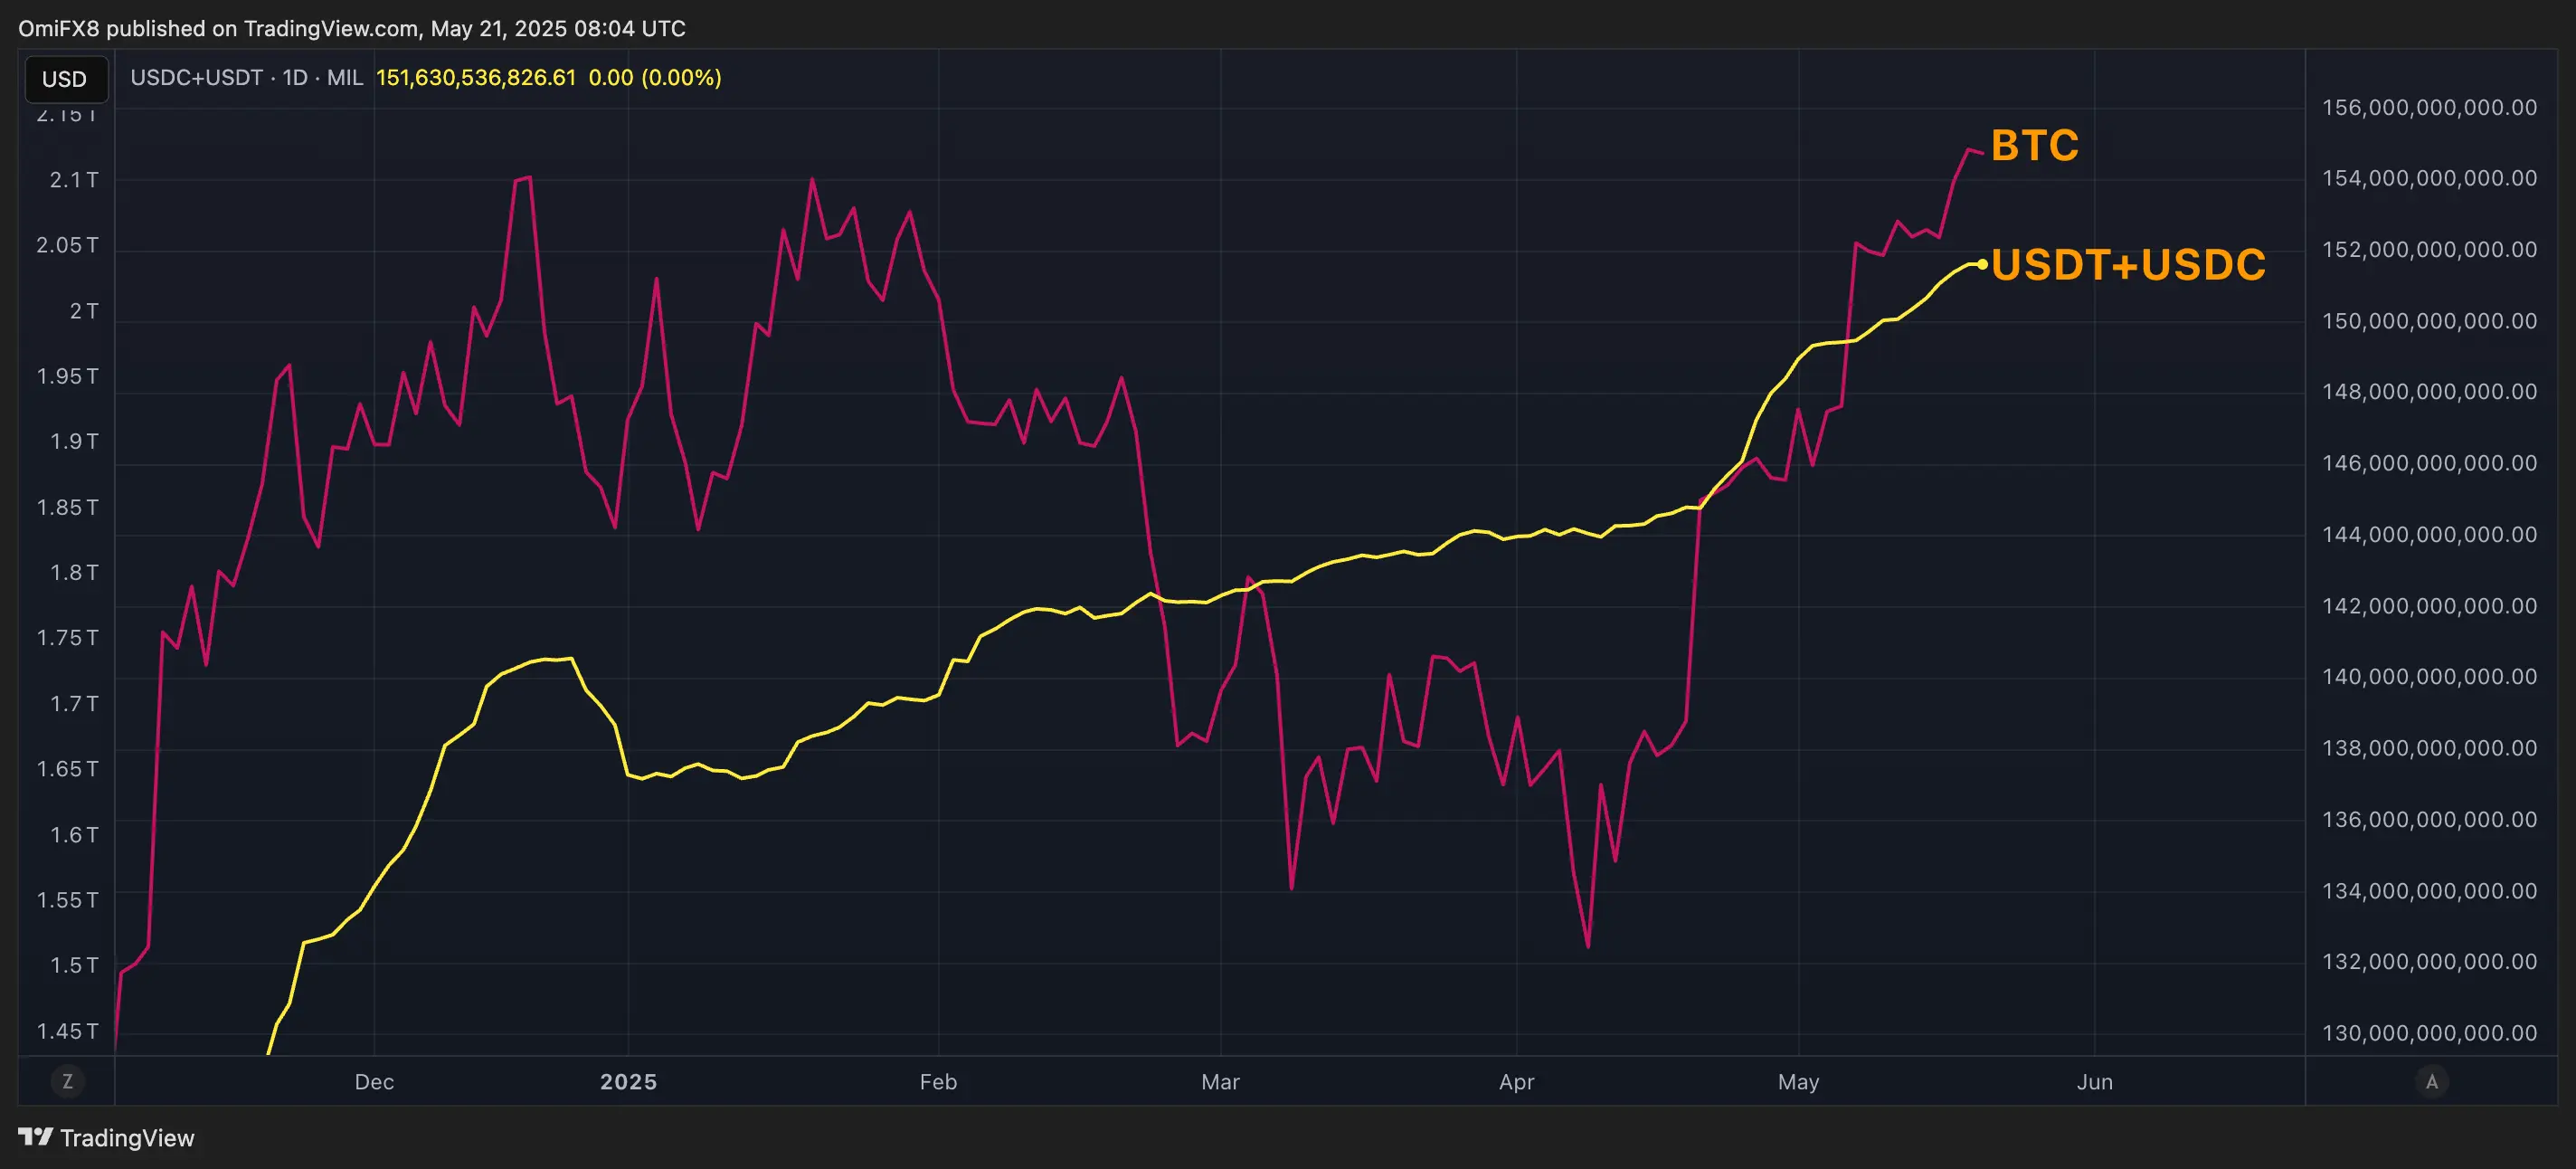
Increased liquidity
- Combined market cap of USDT and USDC at $151 billion, up nearly 9% from December-January averages.
- This indicates greater available capital for investments in Bitcoin and other cryptocurrencies.
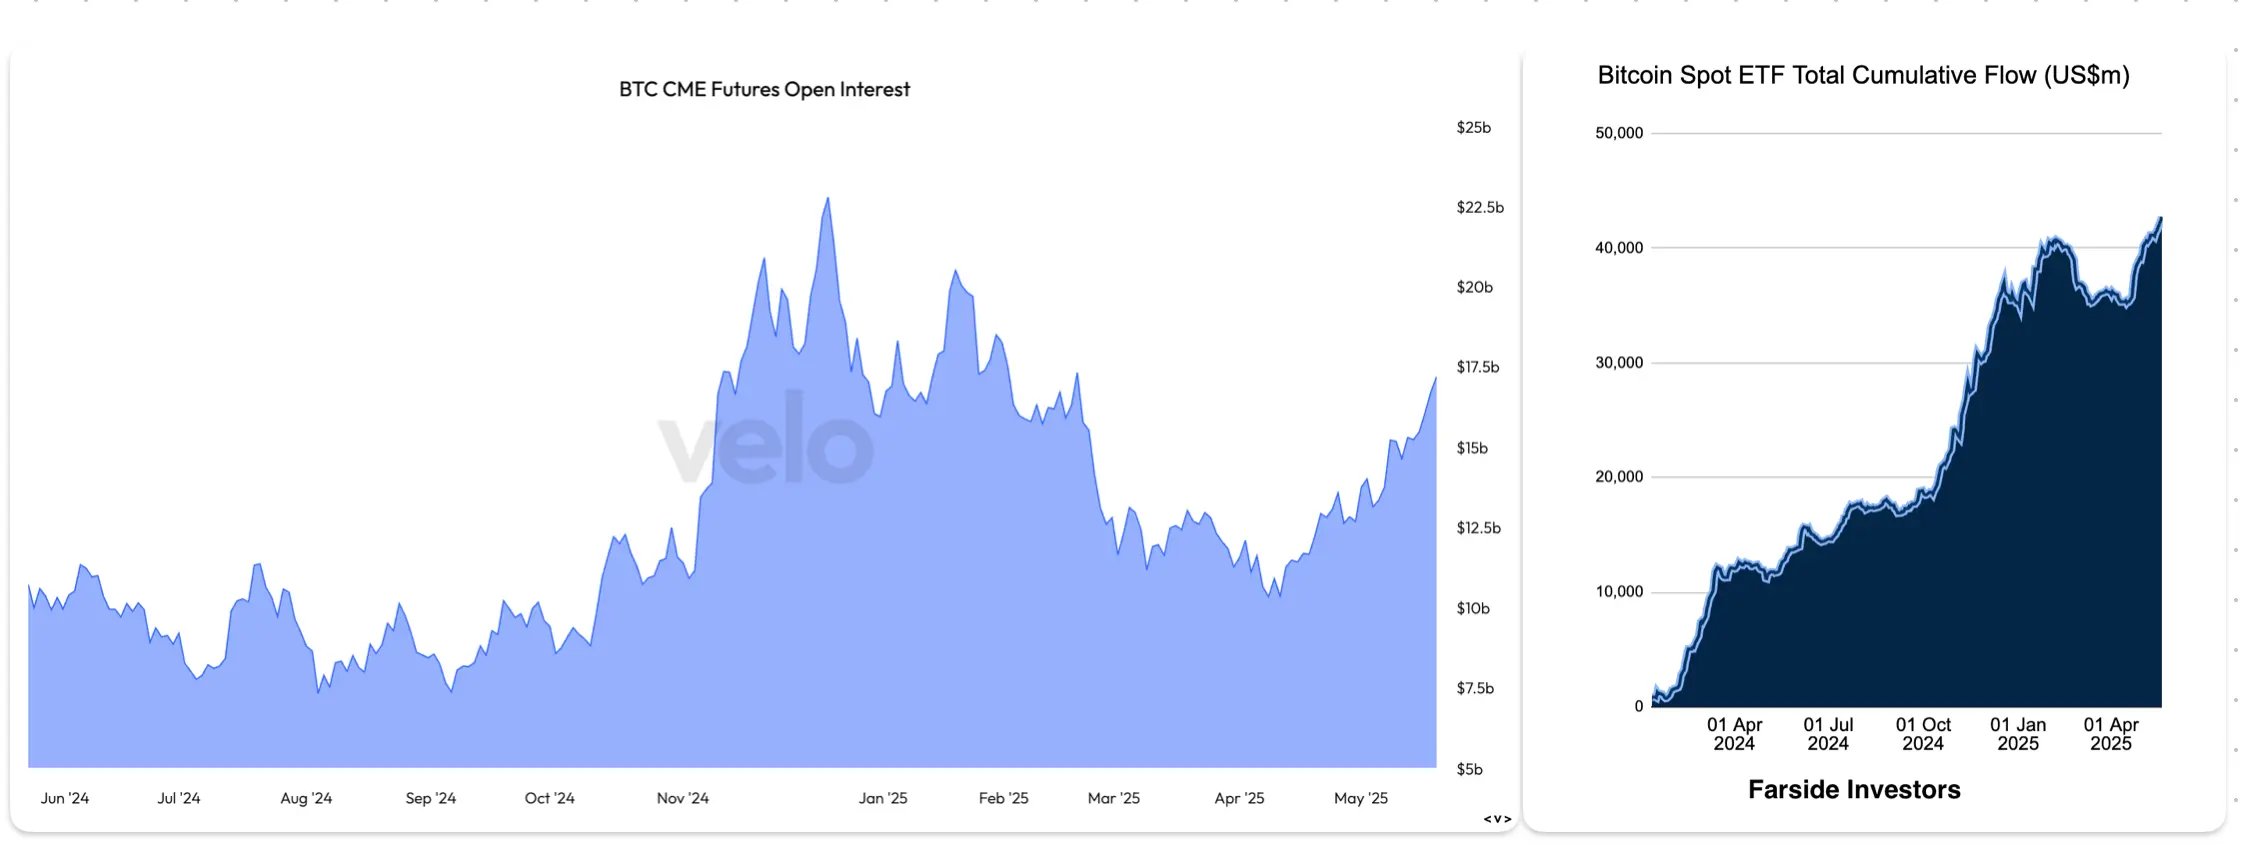
Institutional investment trends
- Significant inflows into U.S.-listed spot Bitcoin ETFs indicate bullish sentiment.
- CME Bitcoin futures open interest at $17 billion, below December's high of $22.79 billion.
- Spot ETF inflows at a record $42.7 billion versus $39.8 billion in January.
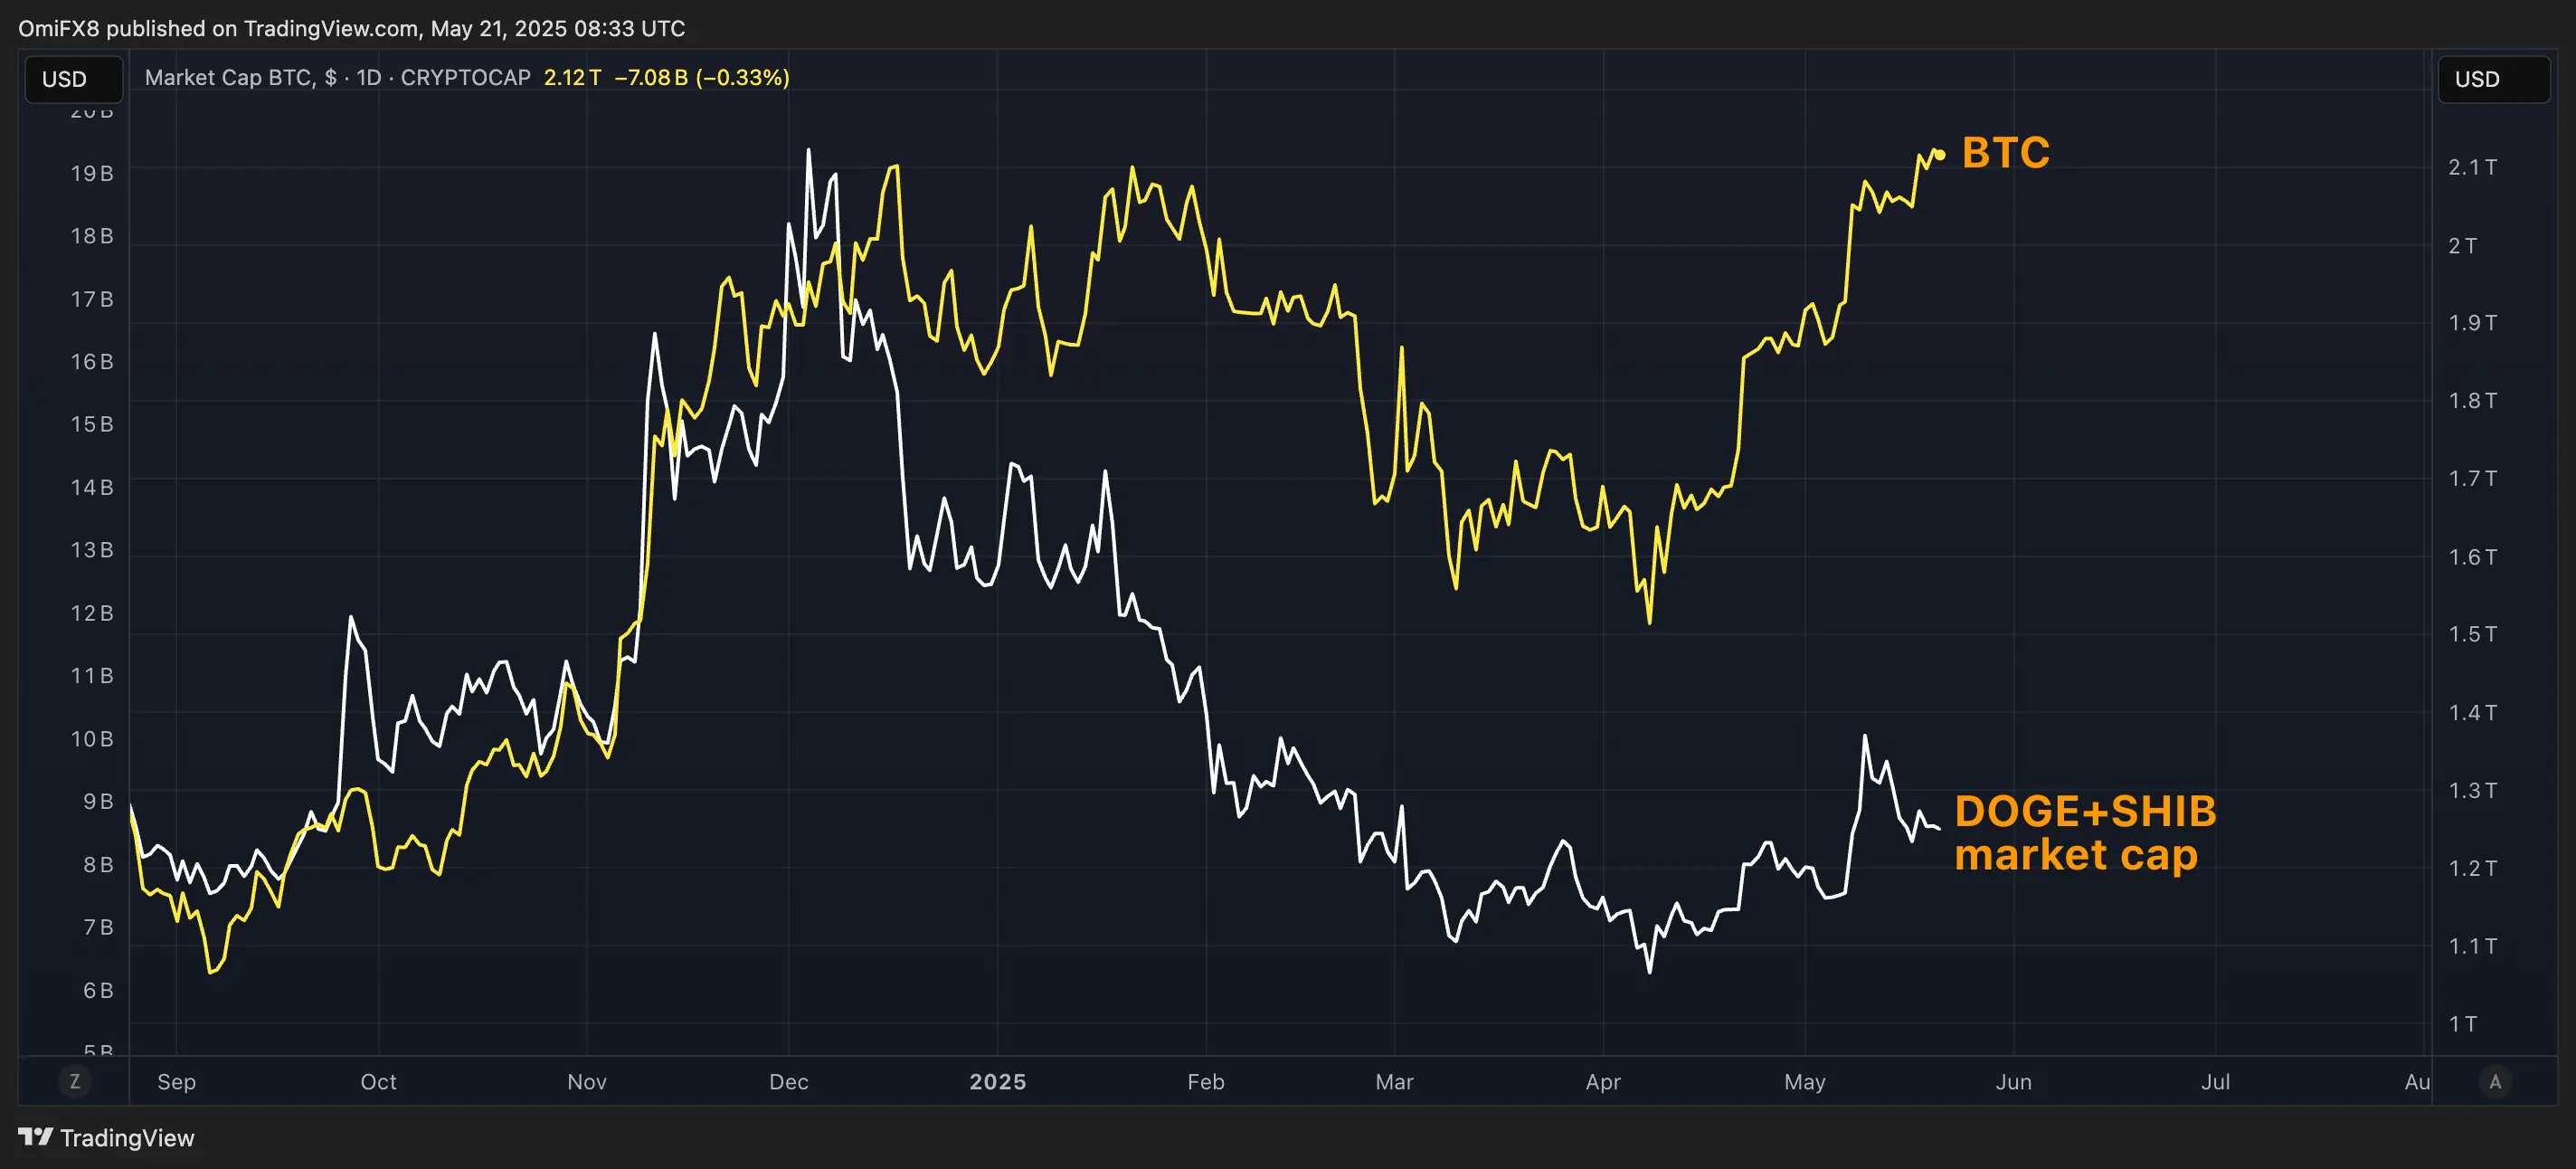
Lack of speculative behavior
- No signs of speculative fervor as seen during previous peaks; DOGE and SHIB market caps remain below January highs.
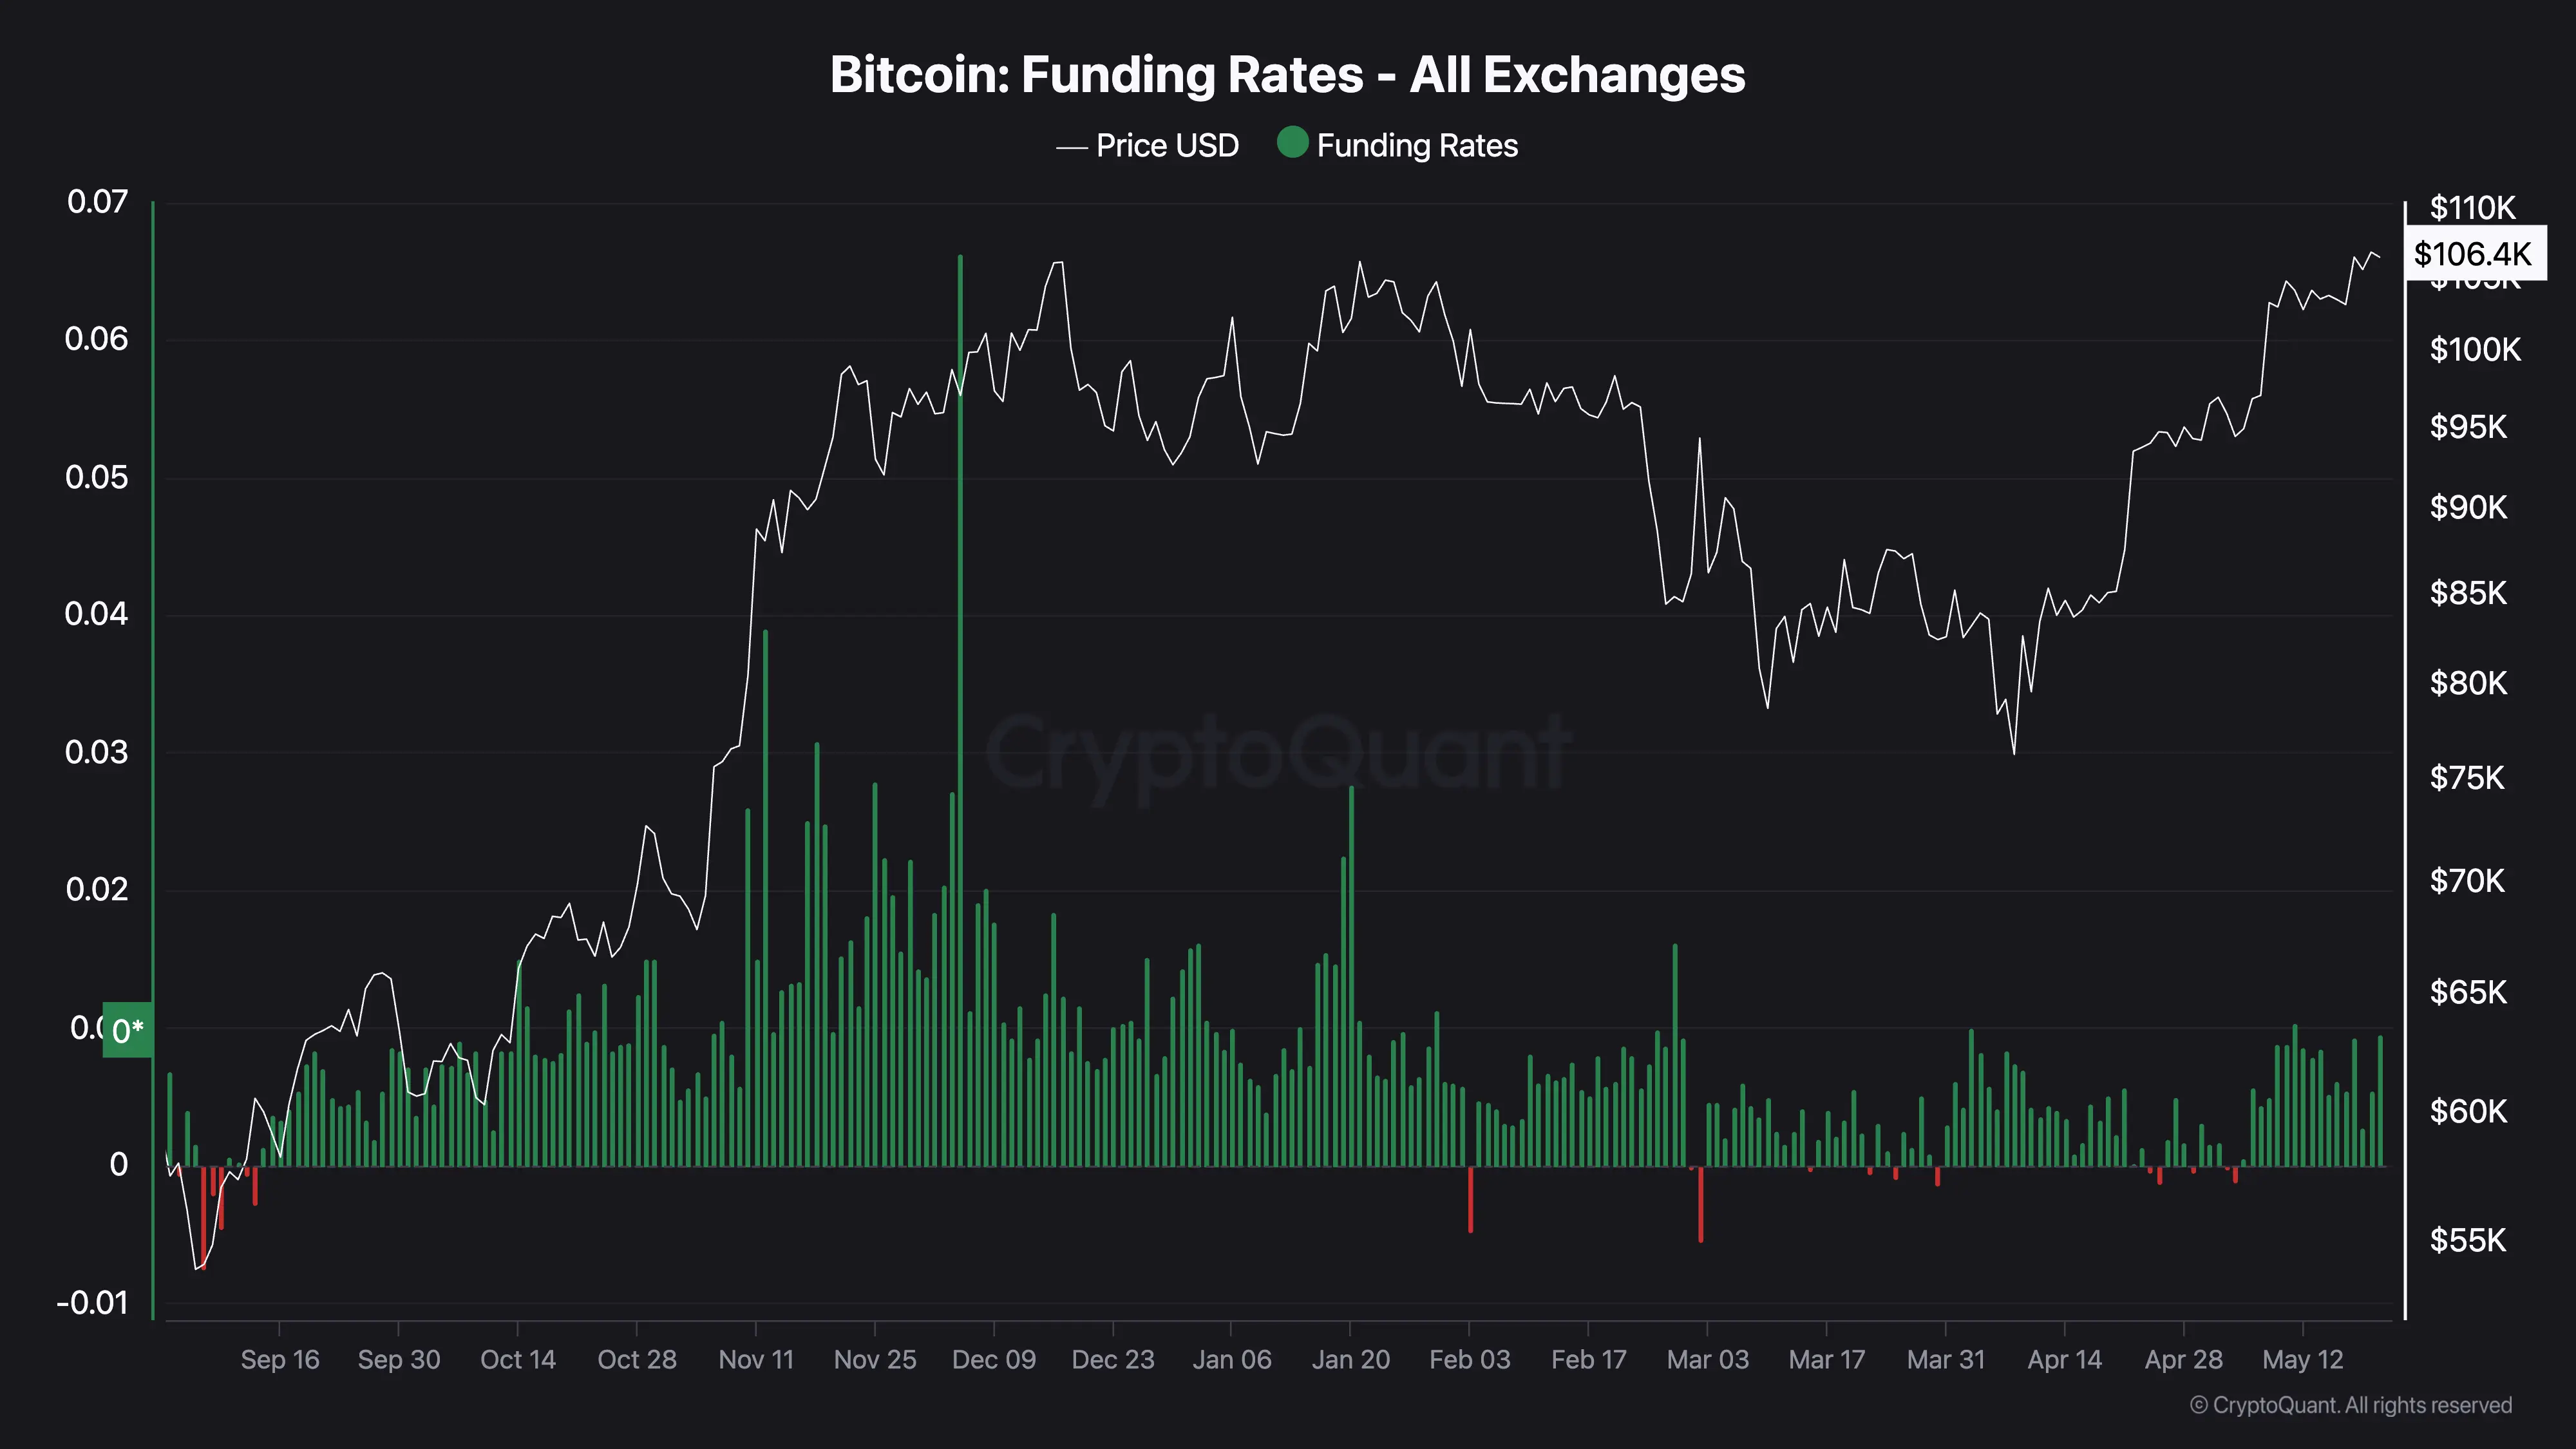
Stable futures market
- Demand for bullish leveraged bets exists, but overall positioning remains light.
- Funding rates are below December levels, indicating no excessive leverage or overheating.
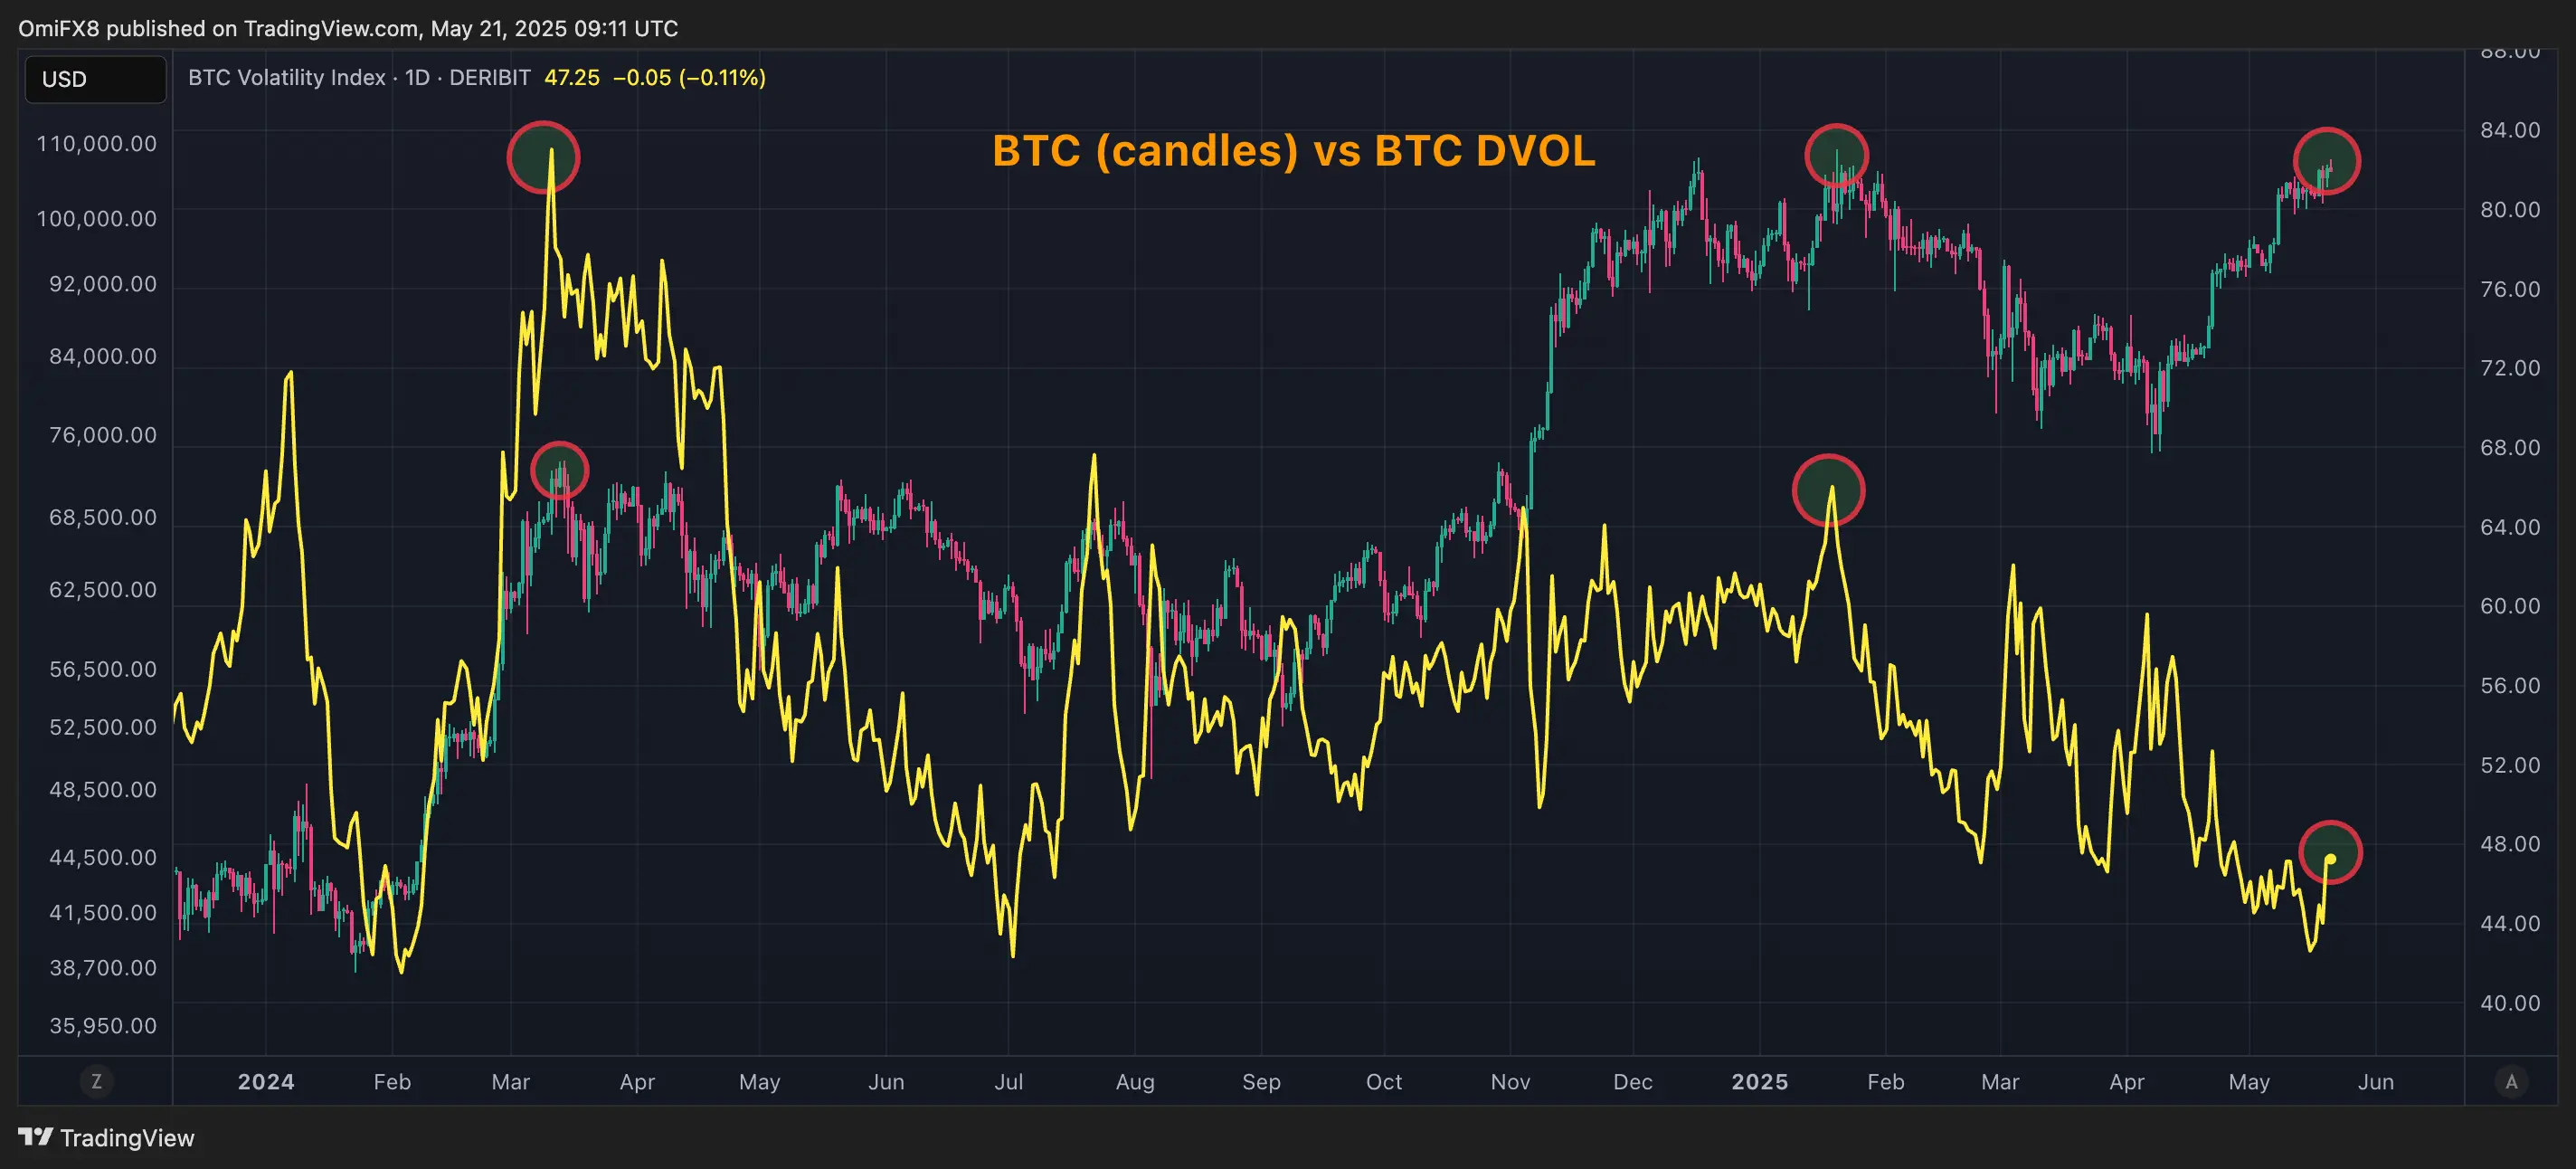
Low implied volatility
- Deribit’s DVOL index shows lower expected volatility compared to previous peaks.
- Indicates a more stable market environment with sustainable growth potential.
