Solana SuperTrend turns bullish, SOL price eyes $103 resistance level
SuperTrend flips bullish on Solana. Solana spot ETF net inflows slide 83% this week to $3.10M.
Analyst Ali Martinez reports the first bullish SuperTrend on Solana (SOL) since early January. He shared the signal on March 13 in an X post.
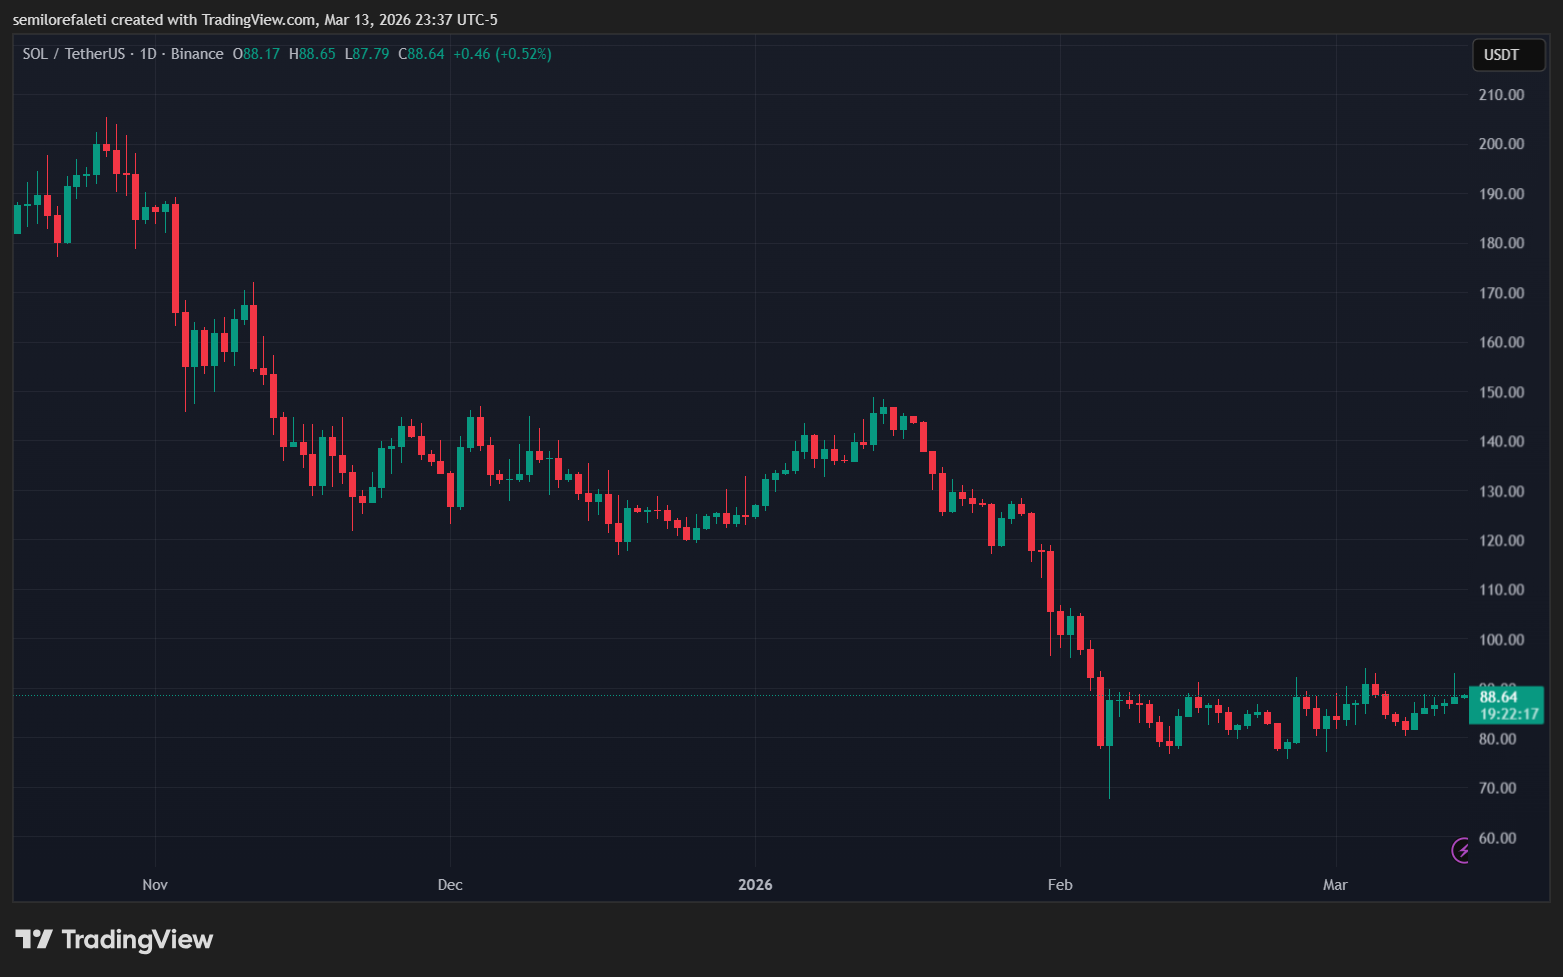
The indicator flashed sell in early February as SOL hit about $67, then price settled into a $76–$90 range for four weeks. SOL twice pushed above $90 in March, with the latest move aligning with the new buy signal. The tool can give false signals. A clean breakout could first test around $103, the stated near-term resistance.
ETF flows cooled. SoSoValue data shows weekly net inflows at $3.10M, down 83% from last week. SOL trades near $88.95, up 2.8% in 24 hours and 11.15% in 30 days, while ETF demand softens. The data suggests spot buying and broader sentiment are driving the move more than institutional flows.
Within five months, cumulative spot ETF inflows reached $961.08M. Net assets are $824.87M, equal to 1.67% of SOL’s market cap. Market cap stands at $54.74B, placing SOL seventh by size, per SoSoValue.
- Range $76–$90. Prior low about $67 in early Feb. Resistance near $103
- ETF weekly net inflow $3.10M, down 83% week over week
- Price $88.95. 24h +2.8%. 30d +11.15%
- Cumulative ETF inflows $961.08M. Net assets $824.87M, 1.67% of cap. Market cap $54.74B, rank #7
Authors credited by the source: Semilore Faleti
Published by Holder based on an external source.