Bitcoin macro triangle breakdown historically triggers retracement; downside risk increases
Bitcoin broke below its macro triangle. Analysts flag a retracement phase and extended consolidation ahead.
Per Rekt Capital, when Bitcoin breaks down from a macro triangle, price typically retraces until a bear-market bottom forms over time.
In 2018 and 2022, the breakdowns accelerated lower, then shifted into bottom accumulation ranges at the end of the move. In 2014, BTC printed two consolidation zones, one right after the breakdown and another later near the final bottom per historical context.
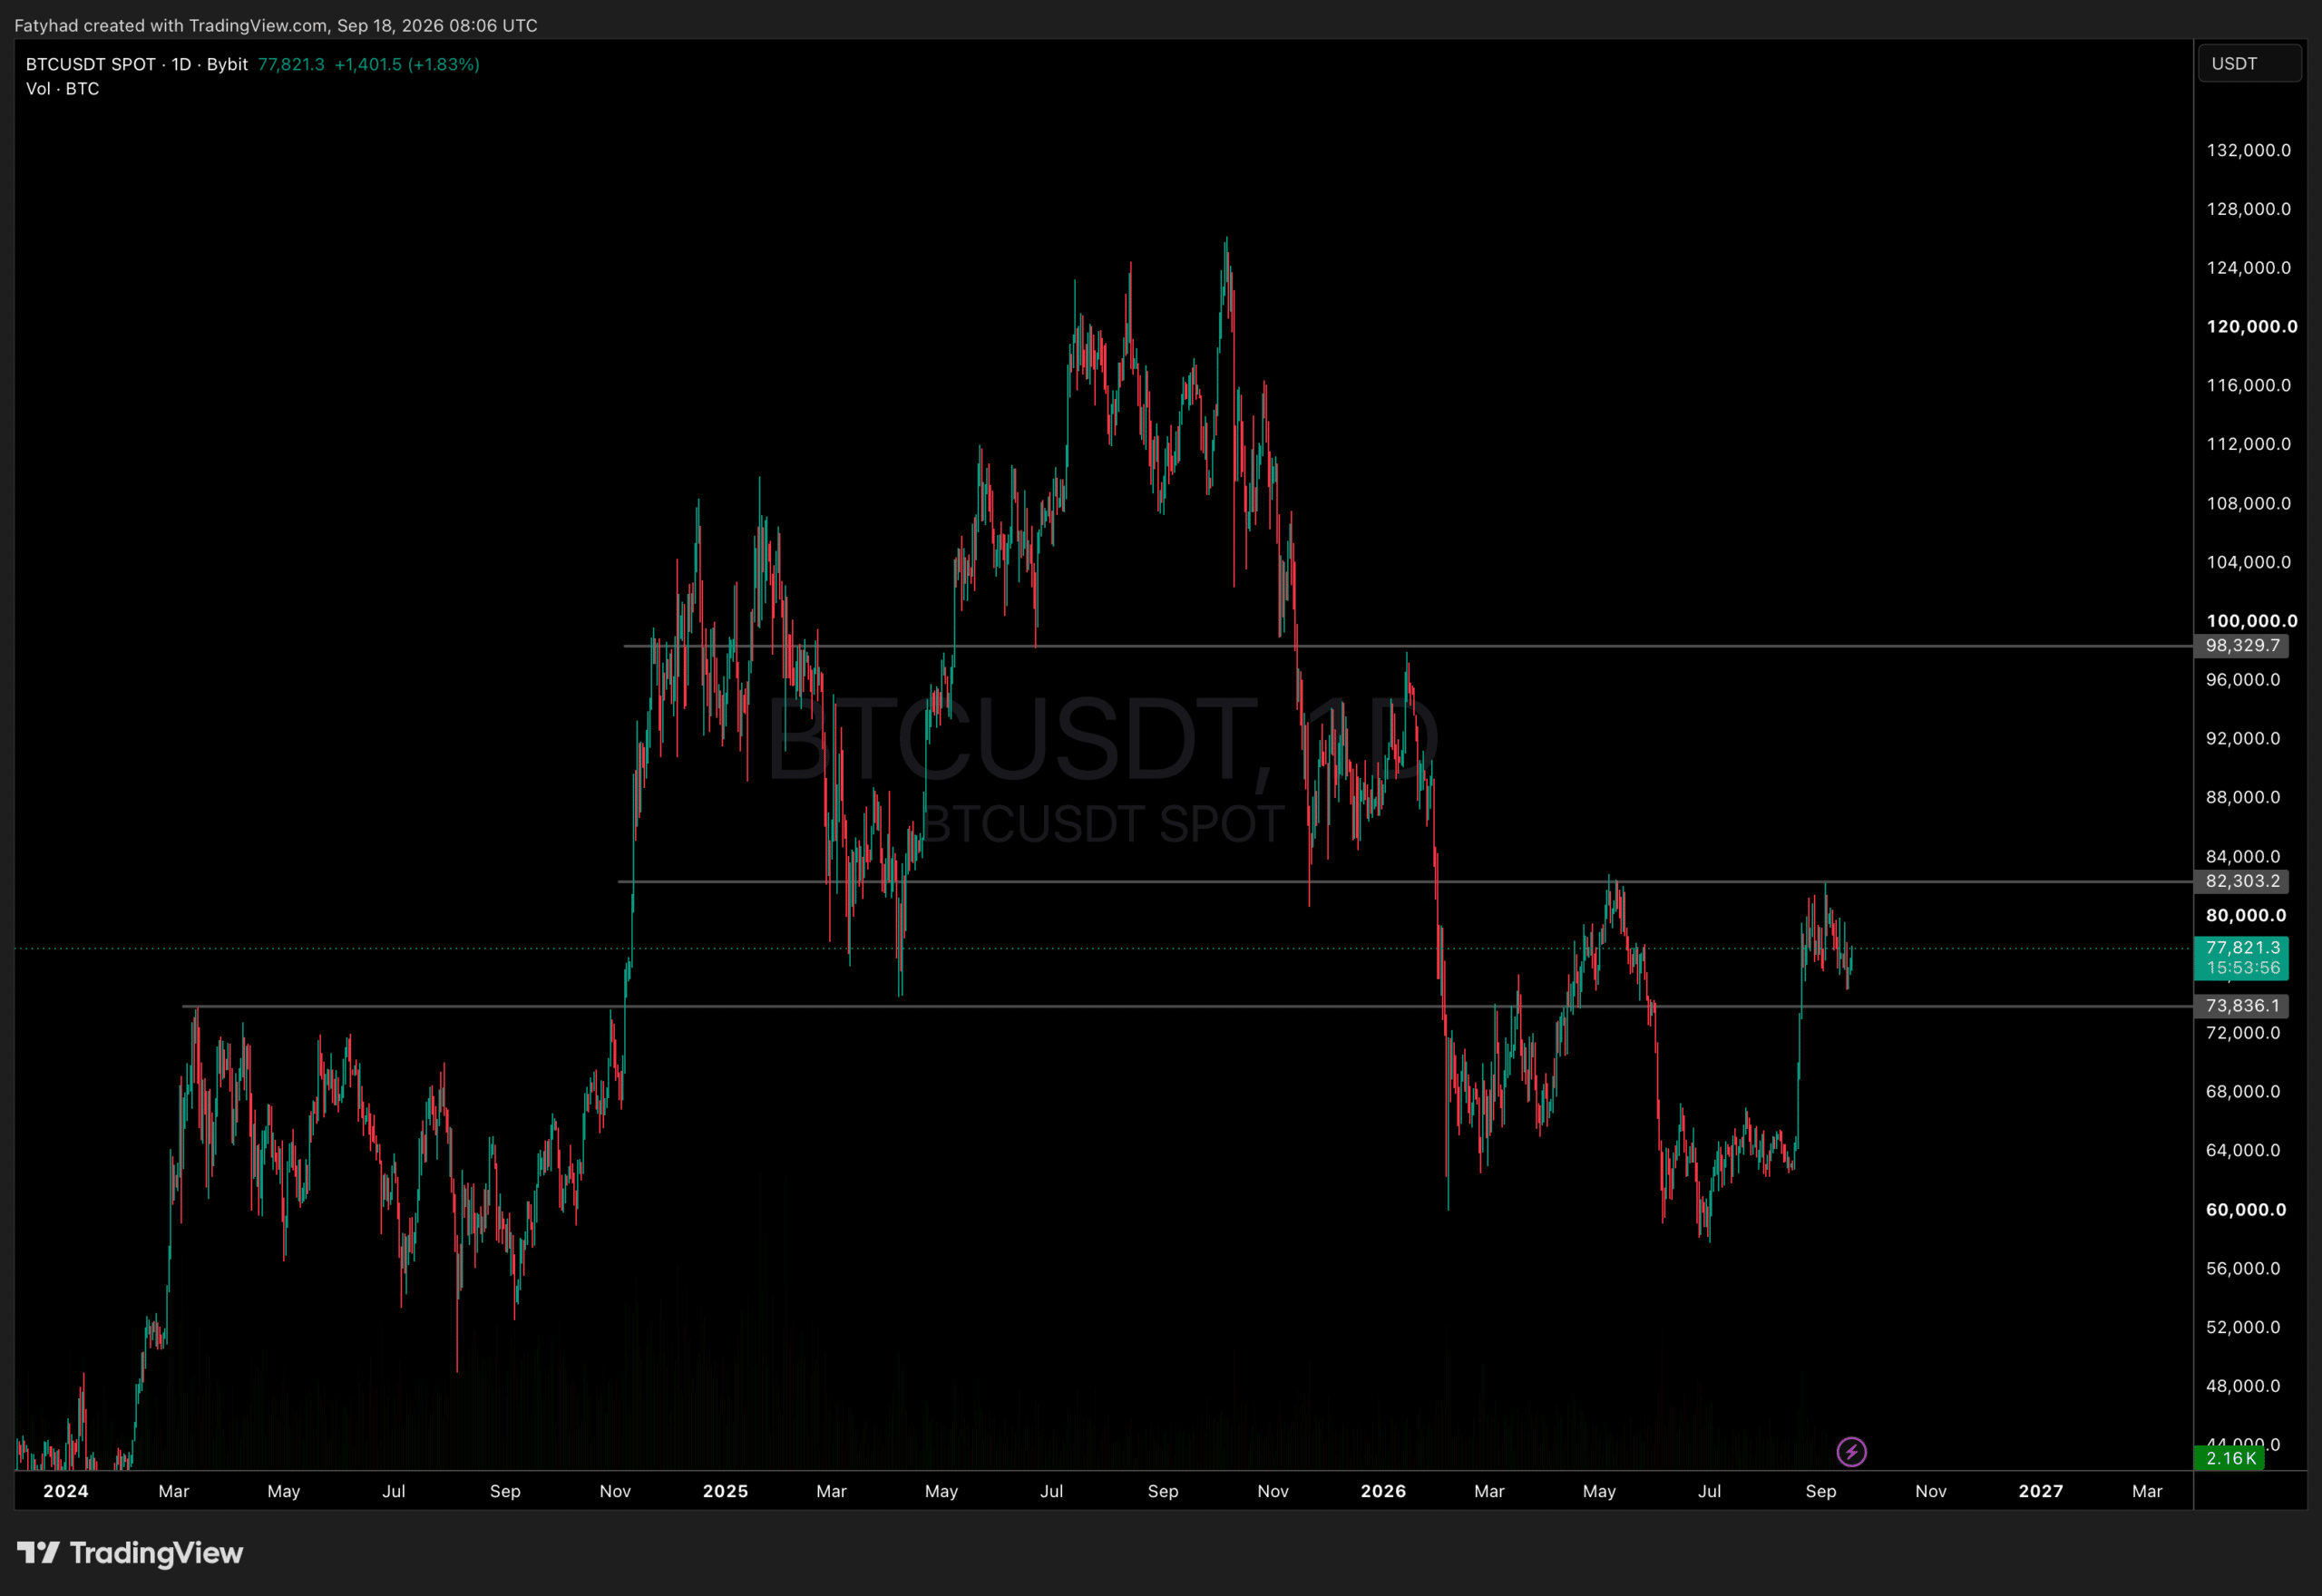
Current structure echoes 2014. Price is consolidating beneath the former triangle base, with ~$82,500 acting as a likely ceiling for the range per the analysis, and recent action sitting below that threshold on market updates.
Rekt Capital notes recurring “orange-box” consolidation zones after such breakdowns. In 2018 and 2022 they formed at the bottom; in 2014, one formed earlier and another at the ultimate low per the thread. If that pattern repeats, the current chop may be interim, with additional macro downside possible before a final base forms per historical analogs.
Trend signals lean bearish:
- HTF head-and-shoulders setup, rejection at range highs per ctm_trader
- Liquidity mostly below; upside liquidity already swept on recent reads
- Daily bearish doji, RSI overbought, MACD turning down per chart notes
- Price below HTF EMAs; LTF structure already broke per the same view
The latest rally skewed news-driven, not organic, and such impulses often retrace historically per the trader.