Analyst says six red monthly candles precede Bitcoin rally to $130K–$250K
Bitcoin has posted multiple red monthly closes since October 2025, sliding over 45% from above $126,000 to below $70,000. An analyst says the structure mirrors 2018–2019 and signals a turn, not a breakdown.
Price has chopped sideways-to-lower for months, pressuring sentiment into fear according to on-chain reads and short-term holder pain tracked by data firms. This slow grind often feels worse than fast sell-offs for traders.
The analyst argues history points to a bottoming phase, not a fresh leg down based on prior cycles, and wrote “With the ongoing panic, buying makes more sense here” on X.
- 2018–2019: six straight red monthly candles took price from ~$7,700 to ~$3,500. By May 2019, price rebounded to ~$10,500. By June, ~ $13,000 per the cited chart.
- 2025–2026: consecutive red candles since October 2025 pulled price from >$126,000 to < $70,000, a controlled ~45% drawdown per market data.
Current selling appears steady, not panicked, with pressure absorbed over time on the monthly chart. Retail sentiment has deteriorated across the decline per Glassnode-based analysis, while institutions moved the other way. Corporates bought 62,000 BTC in Q1 alone despite whale selling, and Strategy added over 122,000 BTC during the downturn per filings coverage.
If the 2019 recovery template repeats, the analyst maps a 3x–4x move from recent lows to ~$180,000–$250,000. Even a 2x bounce from ~$67,000 would set new all-time highs above $130,000 per the same model.
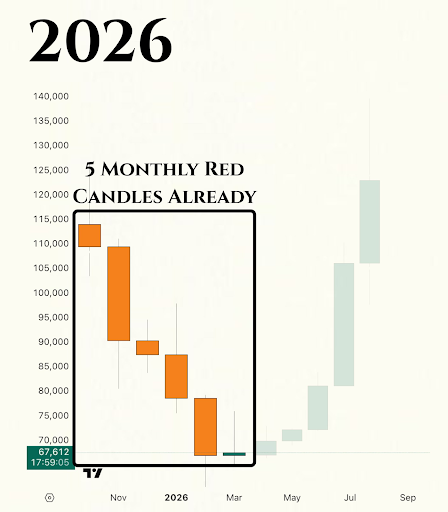
Context: recent chop and fear among short-term holders and range-bound action since late 2025 fit prior bottoming phases, the analyst says using a five-phase framework.