Ethereum processes 203.9M Q2 transactions as active users drop 30%
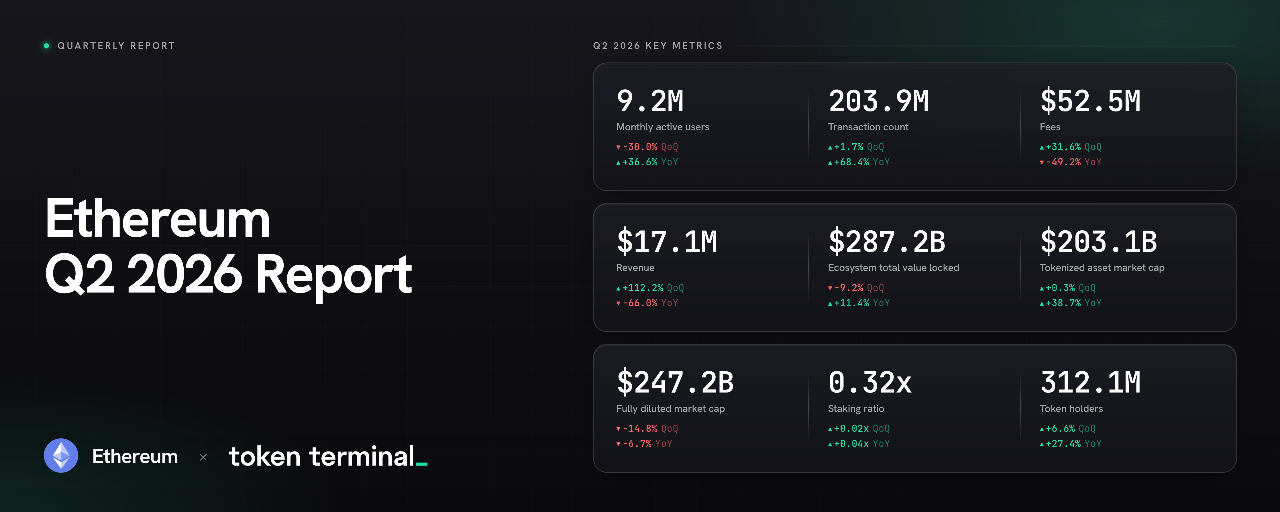
Ethereum’s base layer processed 203.9 million transactions in Q2 2026, up 68.4% year over year. Average throughput reached a record 25.9 transactions per second. ETH traded at $2,474.27, down 1.5% over 24 hours. The data shows higher throughput with fewer distinct participants: activity is increasingly concentrated among high-frequency users, protocols, automated systems, and infrastructure providers rather than a broadening retail base.
Ethereum Q2 2026 Report Token Terminal
Fees, Burn, Staking, and Tokenization
- Onchain fees: up 31.6% to $52.5 million.
- ETH burn revenue: up 112% to $17.1 million, indicating more fee weight per transaction and increased supply removal.
- Staking: 32% of ETH staked. ETH-holding addresses reached 312.1 million.
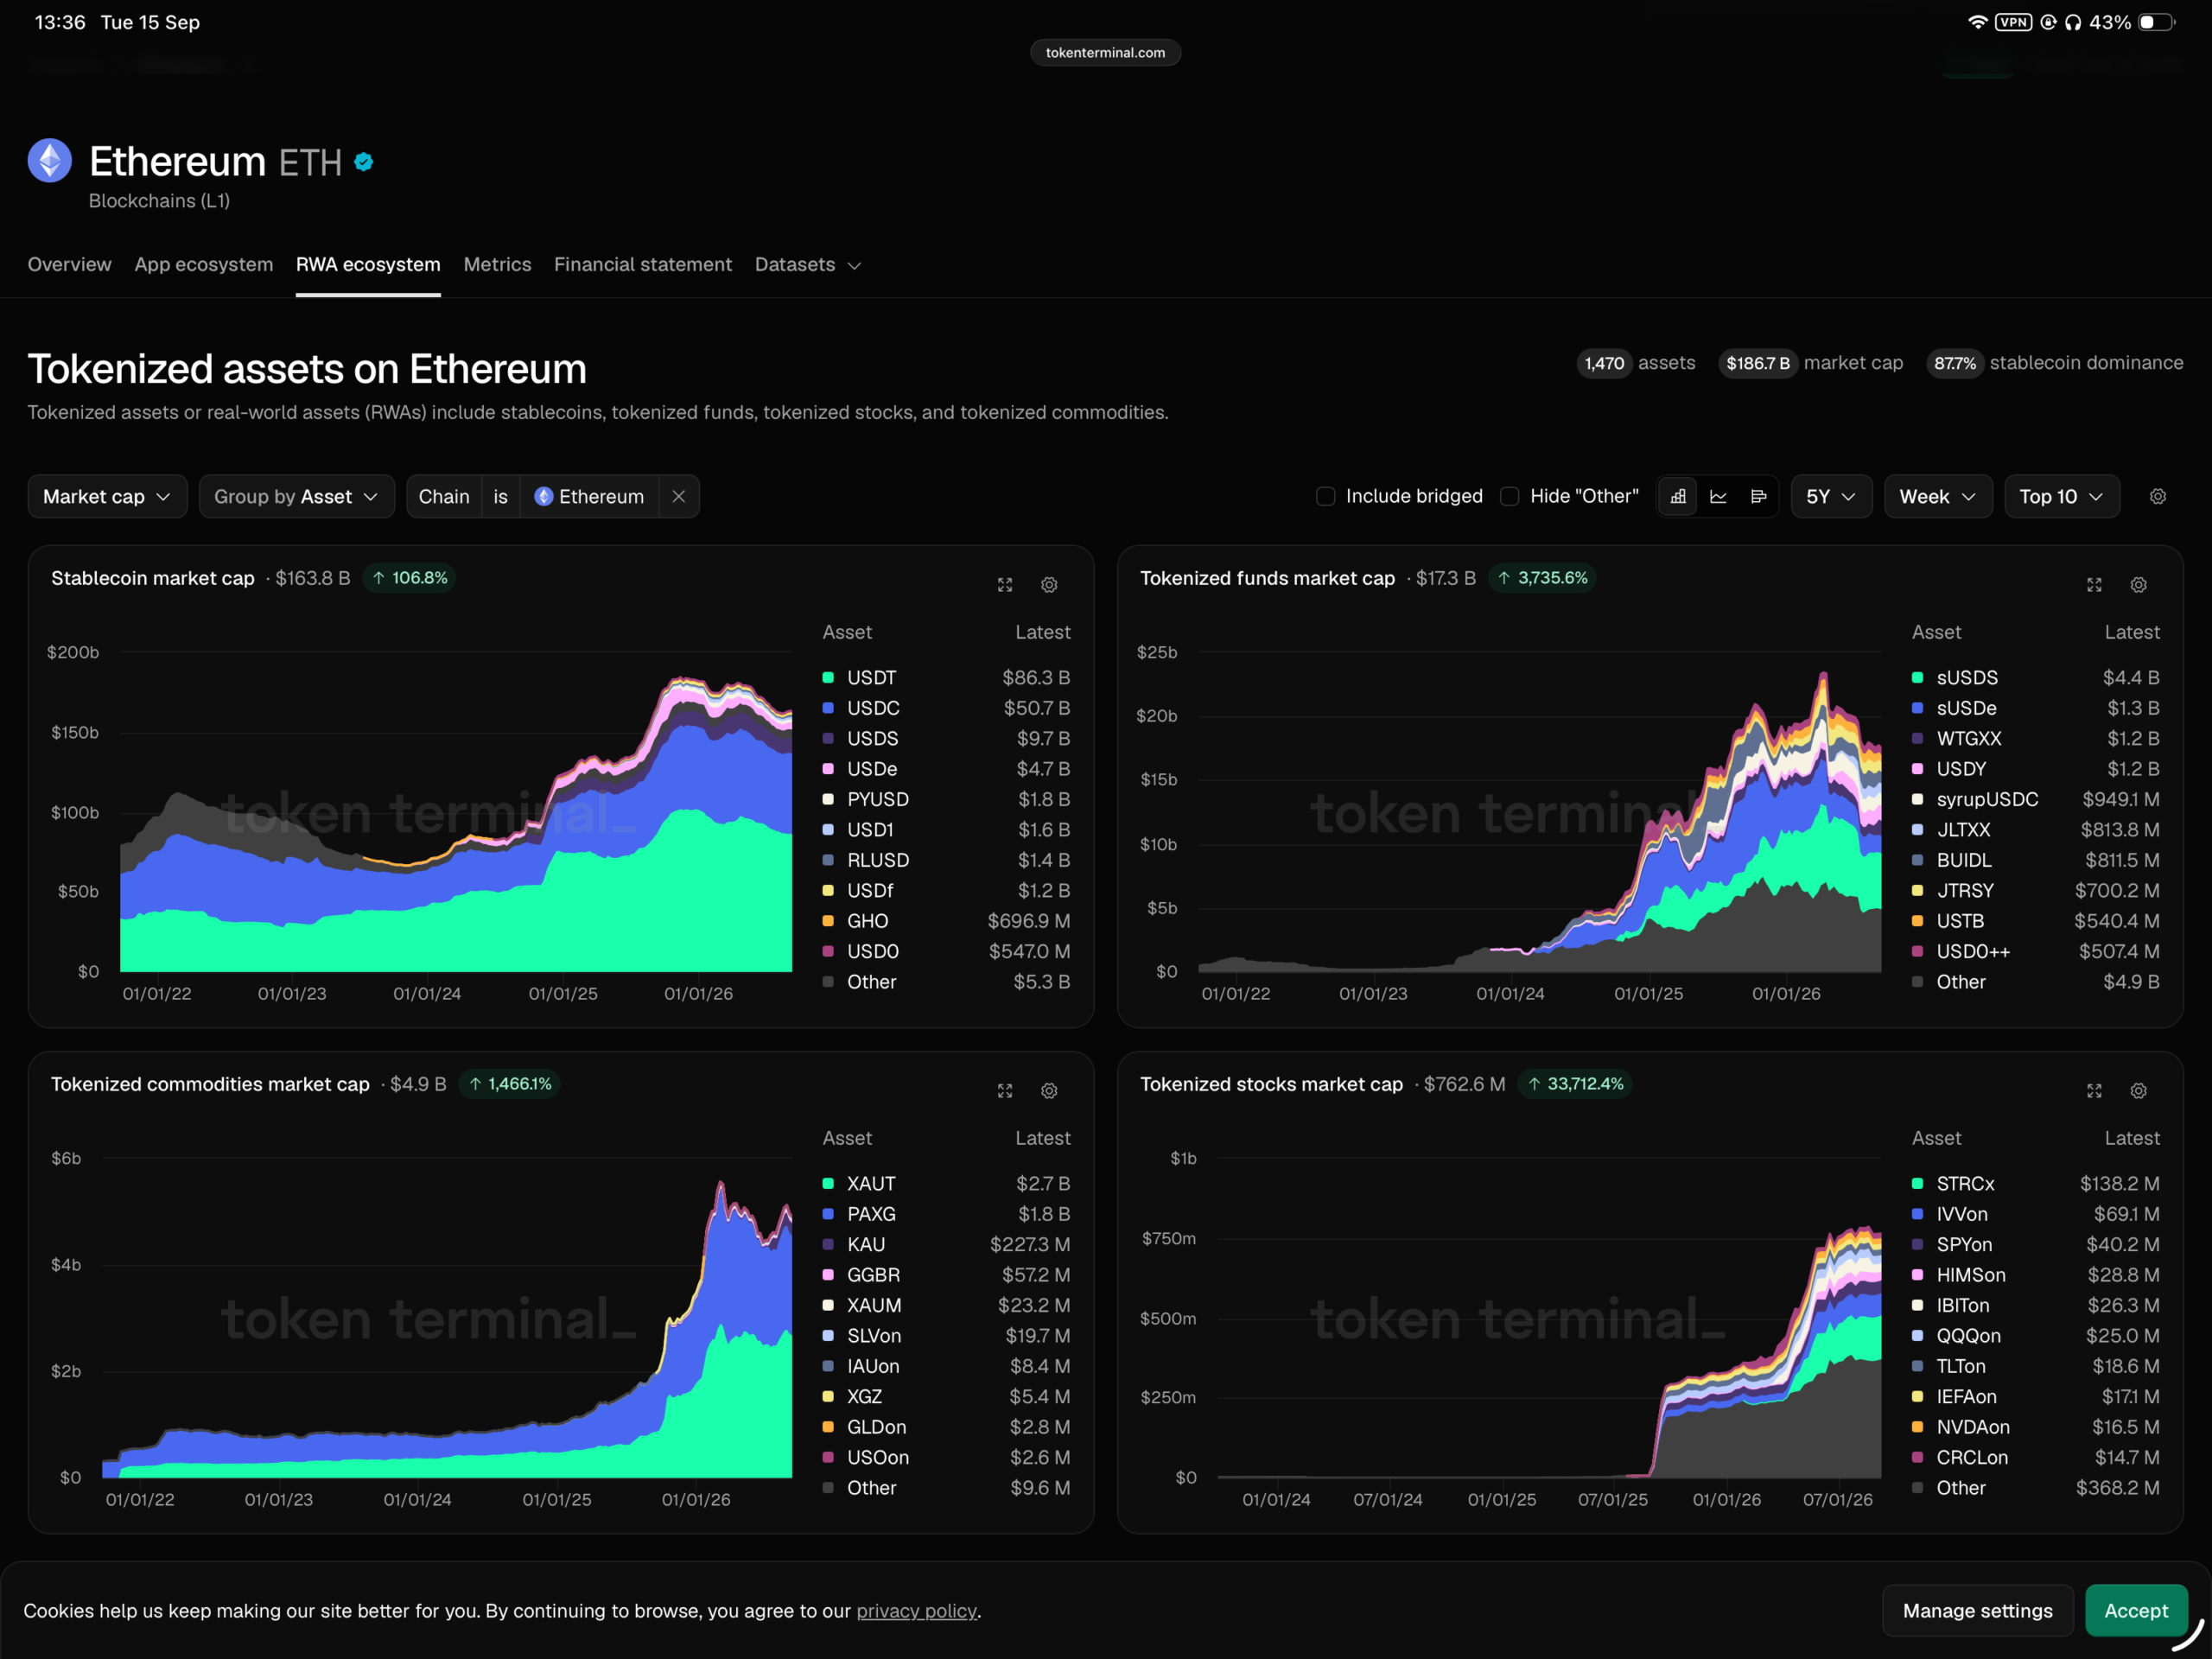
- Tokenization: average $203.1 billion tokenized assets on Ethereum in Q2, including $176.8 billion in stablecoins and $20.8 billion in tokenized funds. This reinforces Ethereum’s role as settlement infrastructure.
Ethereum RWA Ecosystem Token Terminal
These patterns align with concentrated institutional accumulation and cross-chain activity consolidating on Ethereum’s base layer, as reported in external coverage on BitMine’s ETH holdings and Harmony migration.
Trend Continuation and Capacity Notes
- Q1 2026 baseline: 200.4 million L1 transactions and average throughput near 25.78 TPS.
- Monthly active users: averaged about 13.2 million in Q1, followed by a roughly 30% drop, amplifying the concentration trend in Q2.
- Capacity drivers: some research cites a raised block gas limit as a factor, but the primary source does not confirm this.
Market Context and Interpretation
- Q2 combined outcomes: higher fees, higher burn, fewer active participants. The mix signals rising economic intensity per user alongside user-base concentration.
- Staking at 32% reduces liquid supply. Traders often view this as a structural tailwind, but it does not guarantee price outcomes.
- Price path: ETH fell from about $2,400 in early April to near $1,500 by June, then recovered above $2,500 by mid-September. The rebound may reflect either fundamentals or broader market dynamics.
- Forward watchpoint: Q3 active-user trends. Stabilization would support an institutional deepening narrative. Continued decline would indicate further narrowing of the user base.
Machi Big Brother has opened a $98,000,000 $ETH long position.
Liquidation Price: $2,429 pic.twitter.com/ZS0DfJK7As
— Ted (@TedPillows) September 15, 2026