XRP replicates 2017 pattern as analysts forecast rally toward $10–$20
Analysts say XRP is repeating its 2017 bull setup. They forecast a parabolic breakout this year.
@Cryptocupra points to a matching chart structure seen in 2017. He shared a May 4 video with this call, citing historical patterns and a likely upside move on X and in coverage by Bitcoinist here.
In 2017, XRP traded near $0.006 and later broke out, reaching an all‑time high above $3.84 in 2018. This path is detailed by Bitcoinist here.
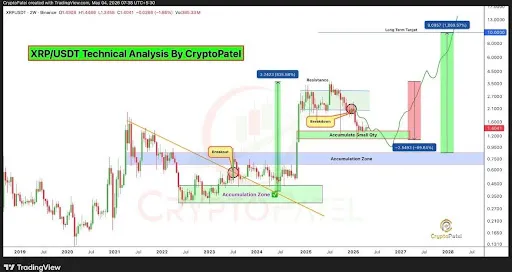
He highlights a descending triangle that broke upward before the 2017 rally. That pattern is shown in analysis here.
The same triangle has formed in 2026 after a 2025 surge above $3.5. XRP has trended down for months and traded in the red, per Bitcoinist reports here and here.
He adds that a “final shakeout” could precede the reversal. That call is covered here.
Crypto Patel keeps a $10–$20 target “absolutely” on the table. He posted the forecast here, despite price near $1.4 and muted action here.
He cites prior moves. XRP went from $0.006 in 2017 to over $3 in 2018 source. It also jumped from $0.50 in Nov 2024 to above $2.60 in 30 days source. Context on “dead coin” claims in 2023 is here source.
He marks an accumulation zone between $0.70 and $1.10. He argues the network is faster and cheaper than Bitcoin and Ethereum, and used by banks. These points are his claims in the same thread here.
- Setup watched is a descending triangle breakout source.
- Targets mentioned are $10–$20 on successful breakout source.
- Price references include $1.4 current, $0.70–$1.10 zone, $3.84 ATH source, source.