XRP drops 7% after $1.60 rejection as ETFs keep buying
XRP fell more than 7% to around $1.48 after another rejection near $1.60. The token underperformed a soft crypto market as total market cap slipped about 3% to $2.85 trillion and Bitcoin dropped below $84,000 after peaking above $87,000. XRP’s 24-hour range: $1.48–$1.60. Volume: $4.87 billion. Market cap: $92.7 billion. Per derivatives data cited on X, funding is mixed: BTC and ETH do not show crowded longs, while negative funding in XRP and select altcoins indicates cautious positioning and potential for a squeeze if price advances.
A hard ceiling at $1.60
The $1.53–$1.60 zone has capped every meaningful XRP rally since it broke down from that area in February. Holders who bought before that breakdown remain near breakeven there and often sell into rallies, creating supply that has not yet been absorbed. This is the second rejection in about a week. A rapid $7,000 rise in Bitcoin earlier in the week left the market stretched and contributed to a sharper pullback.
Institutional flows
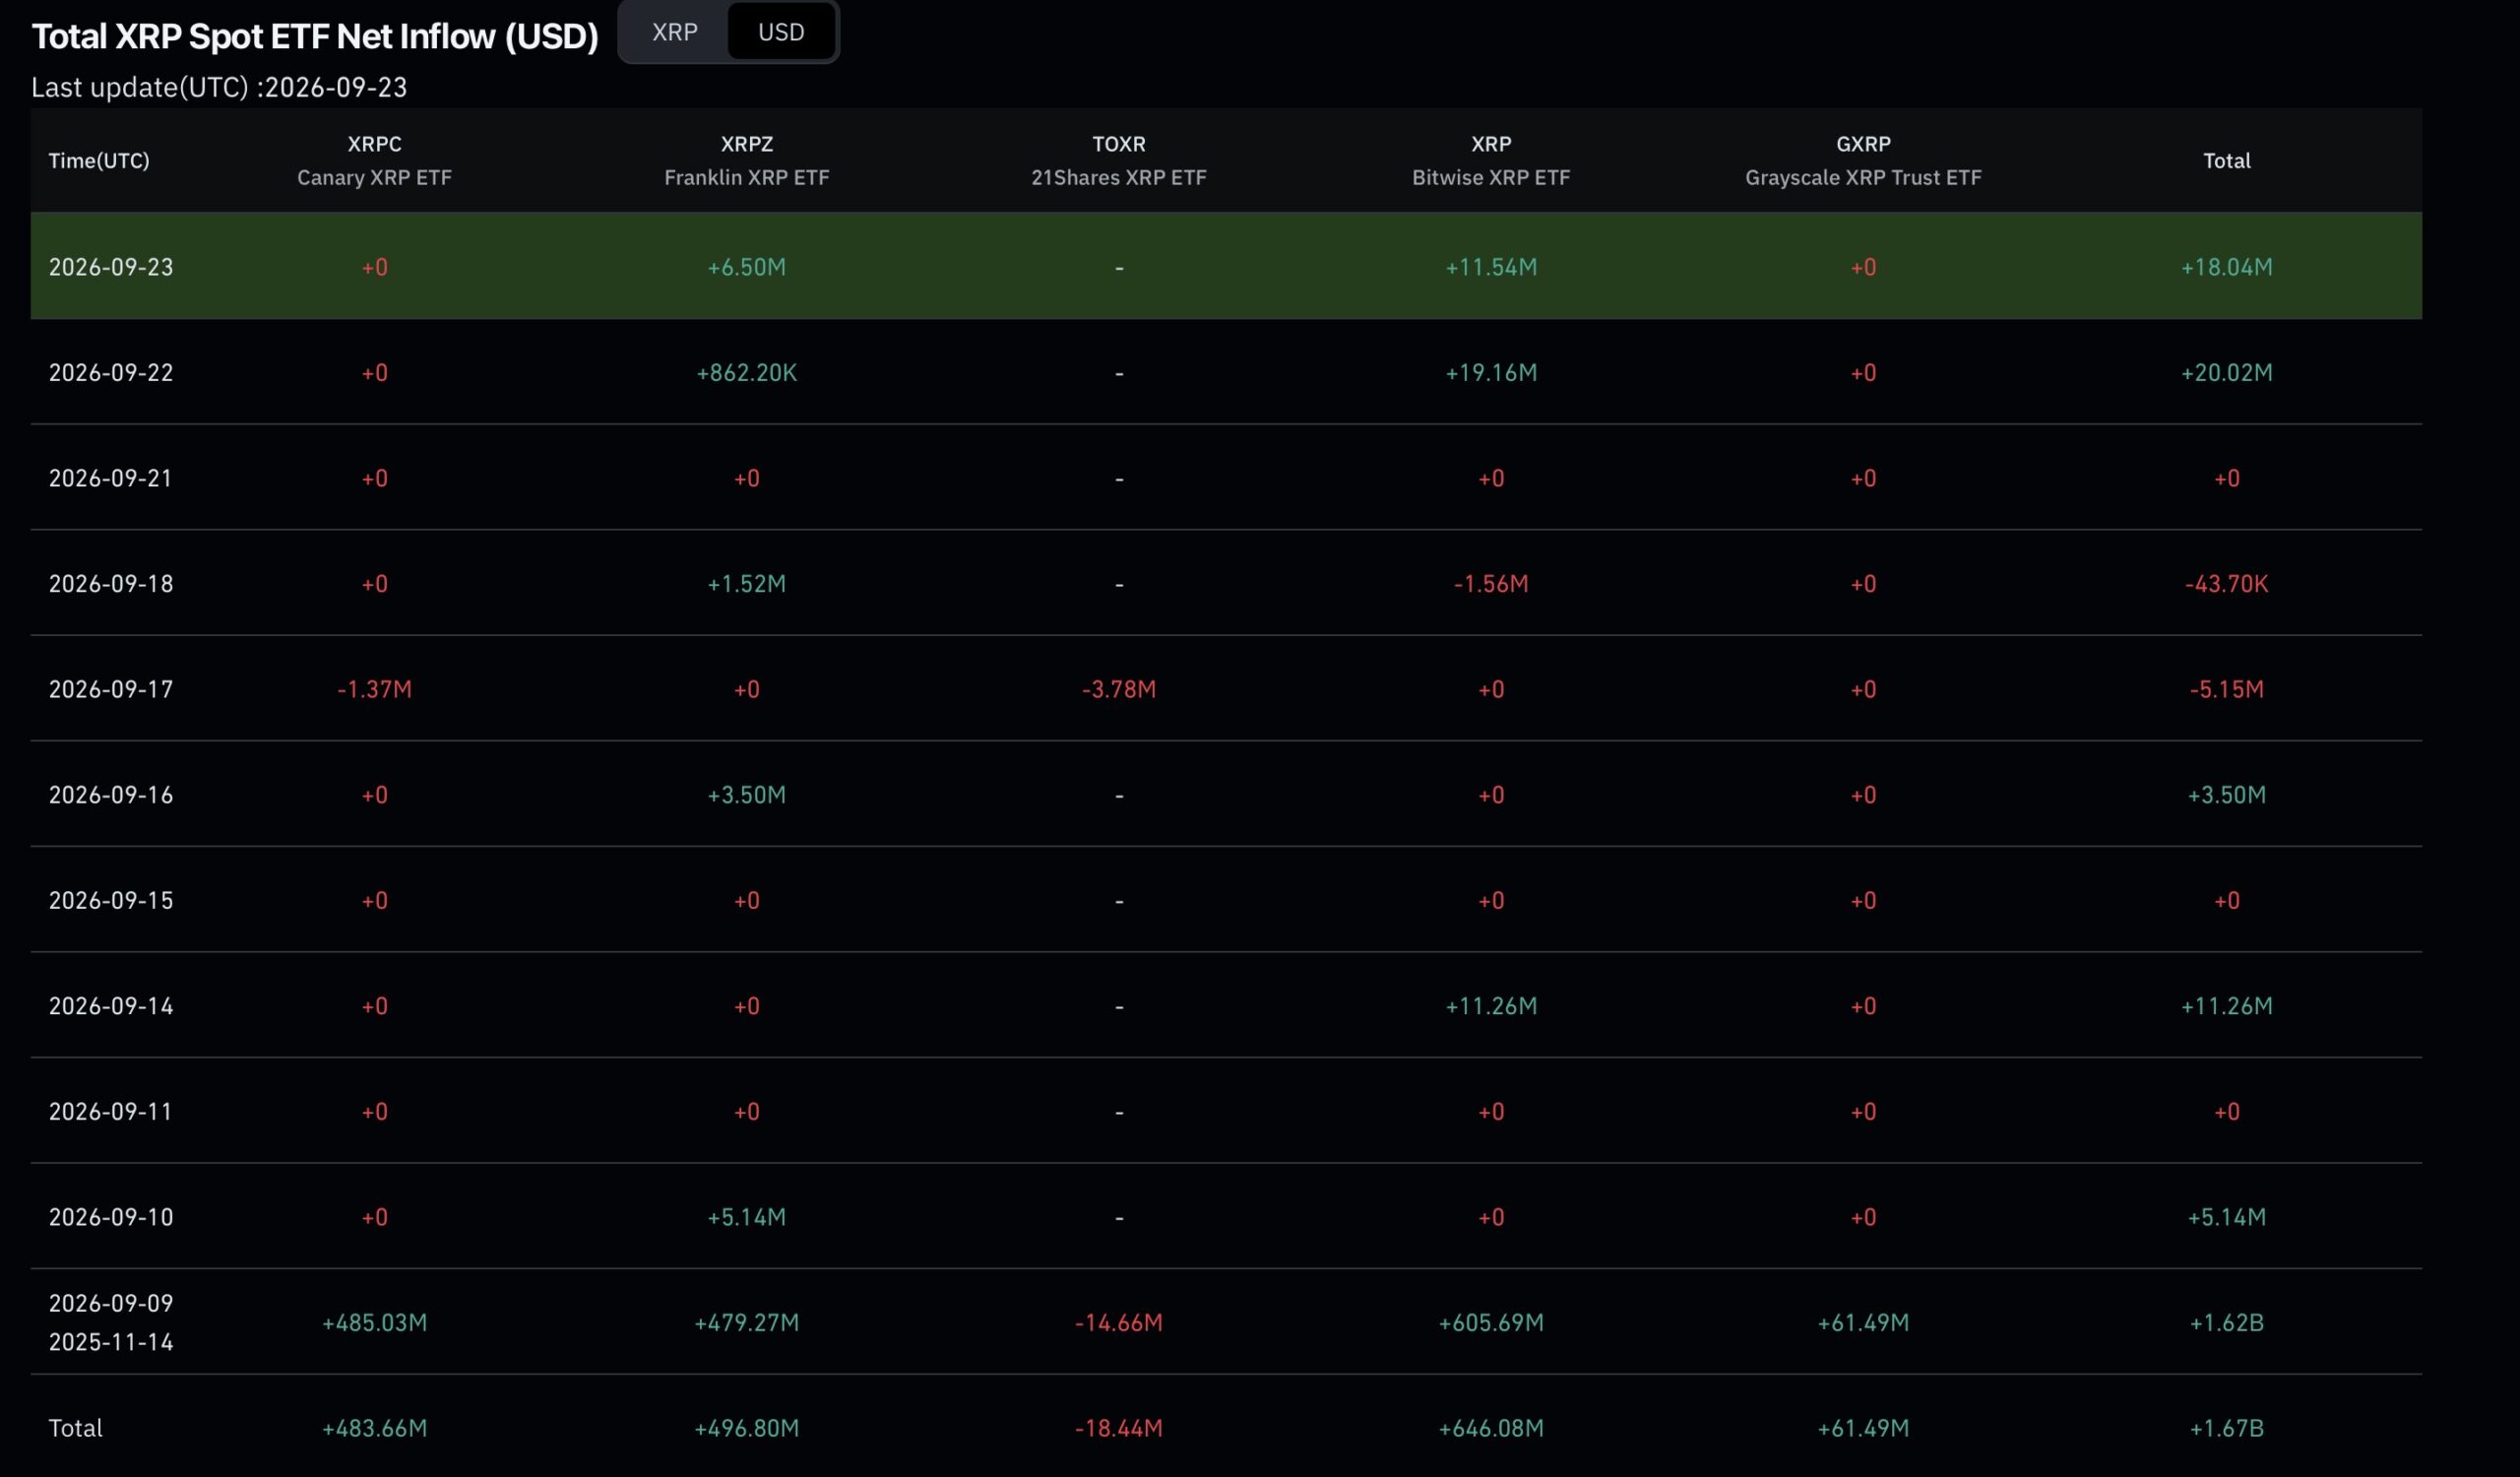
XRP ETF Flow Coinglass
Spot XRP ETFs recorded net inflows during the pullback: $18.04 million on September 23 and $20.02 million on September 22. Bitwise led with $11.54 million, followed by Franklin at $6.5 million. Cumulative ETF holdings since November 2025 total $1.67 billion. Daily inflows are modest versus XRP’s trading volume but indicate continued institutional accumulation despite price resistance.
Key levels and structure
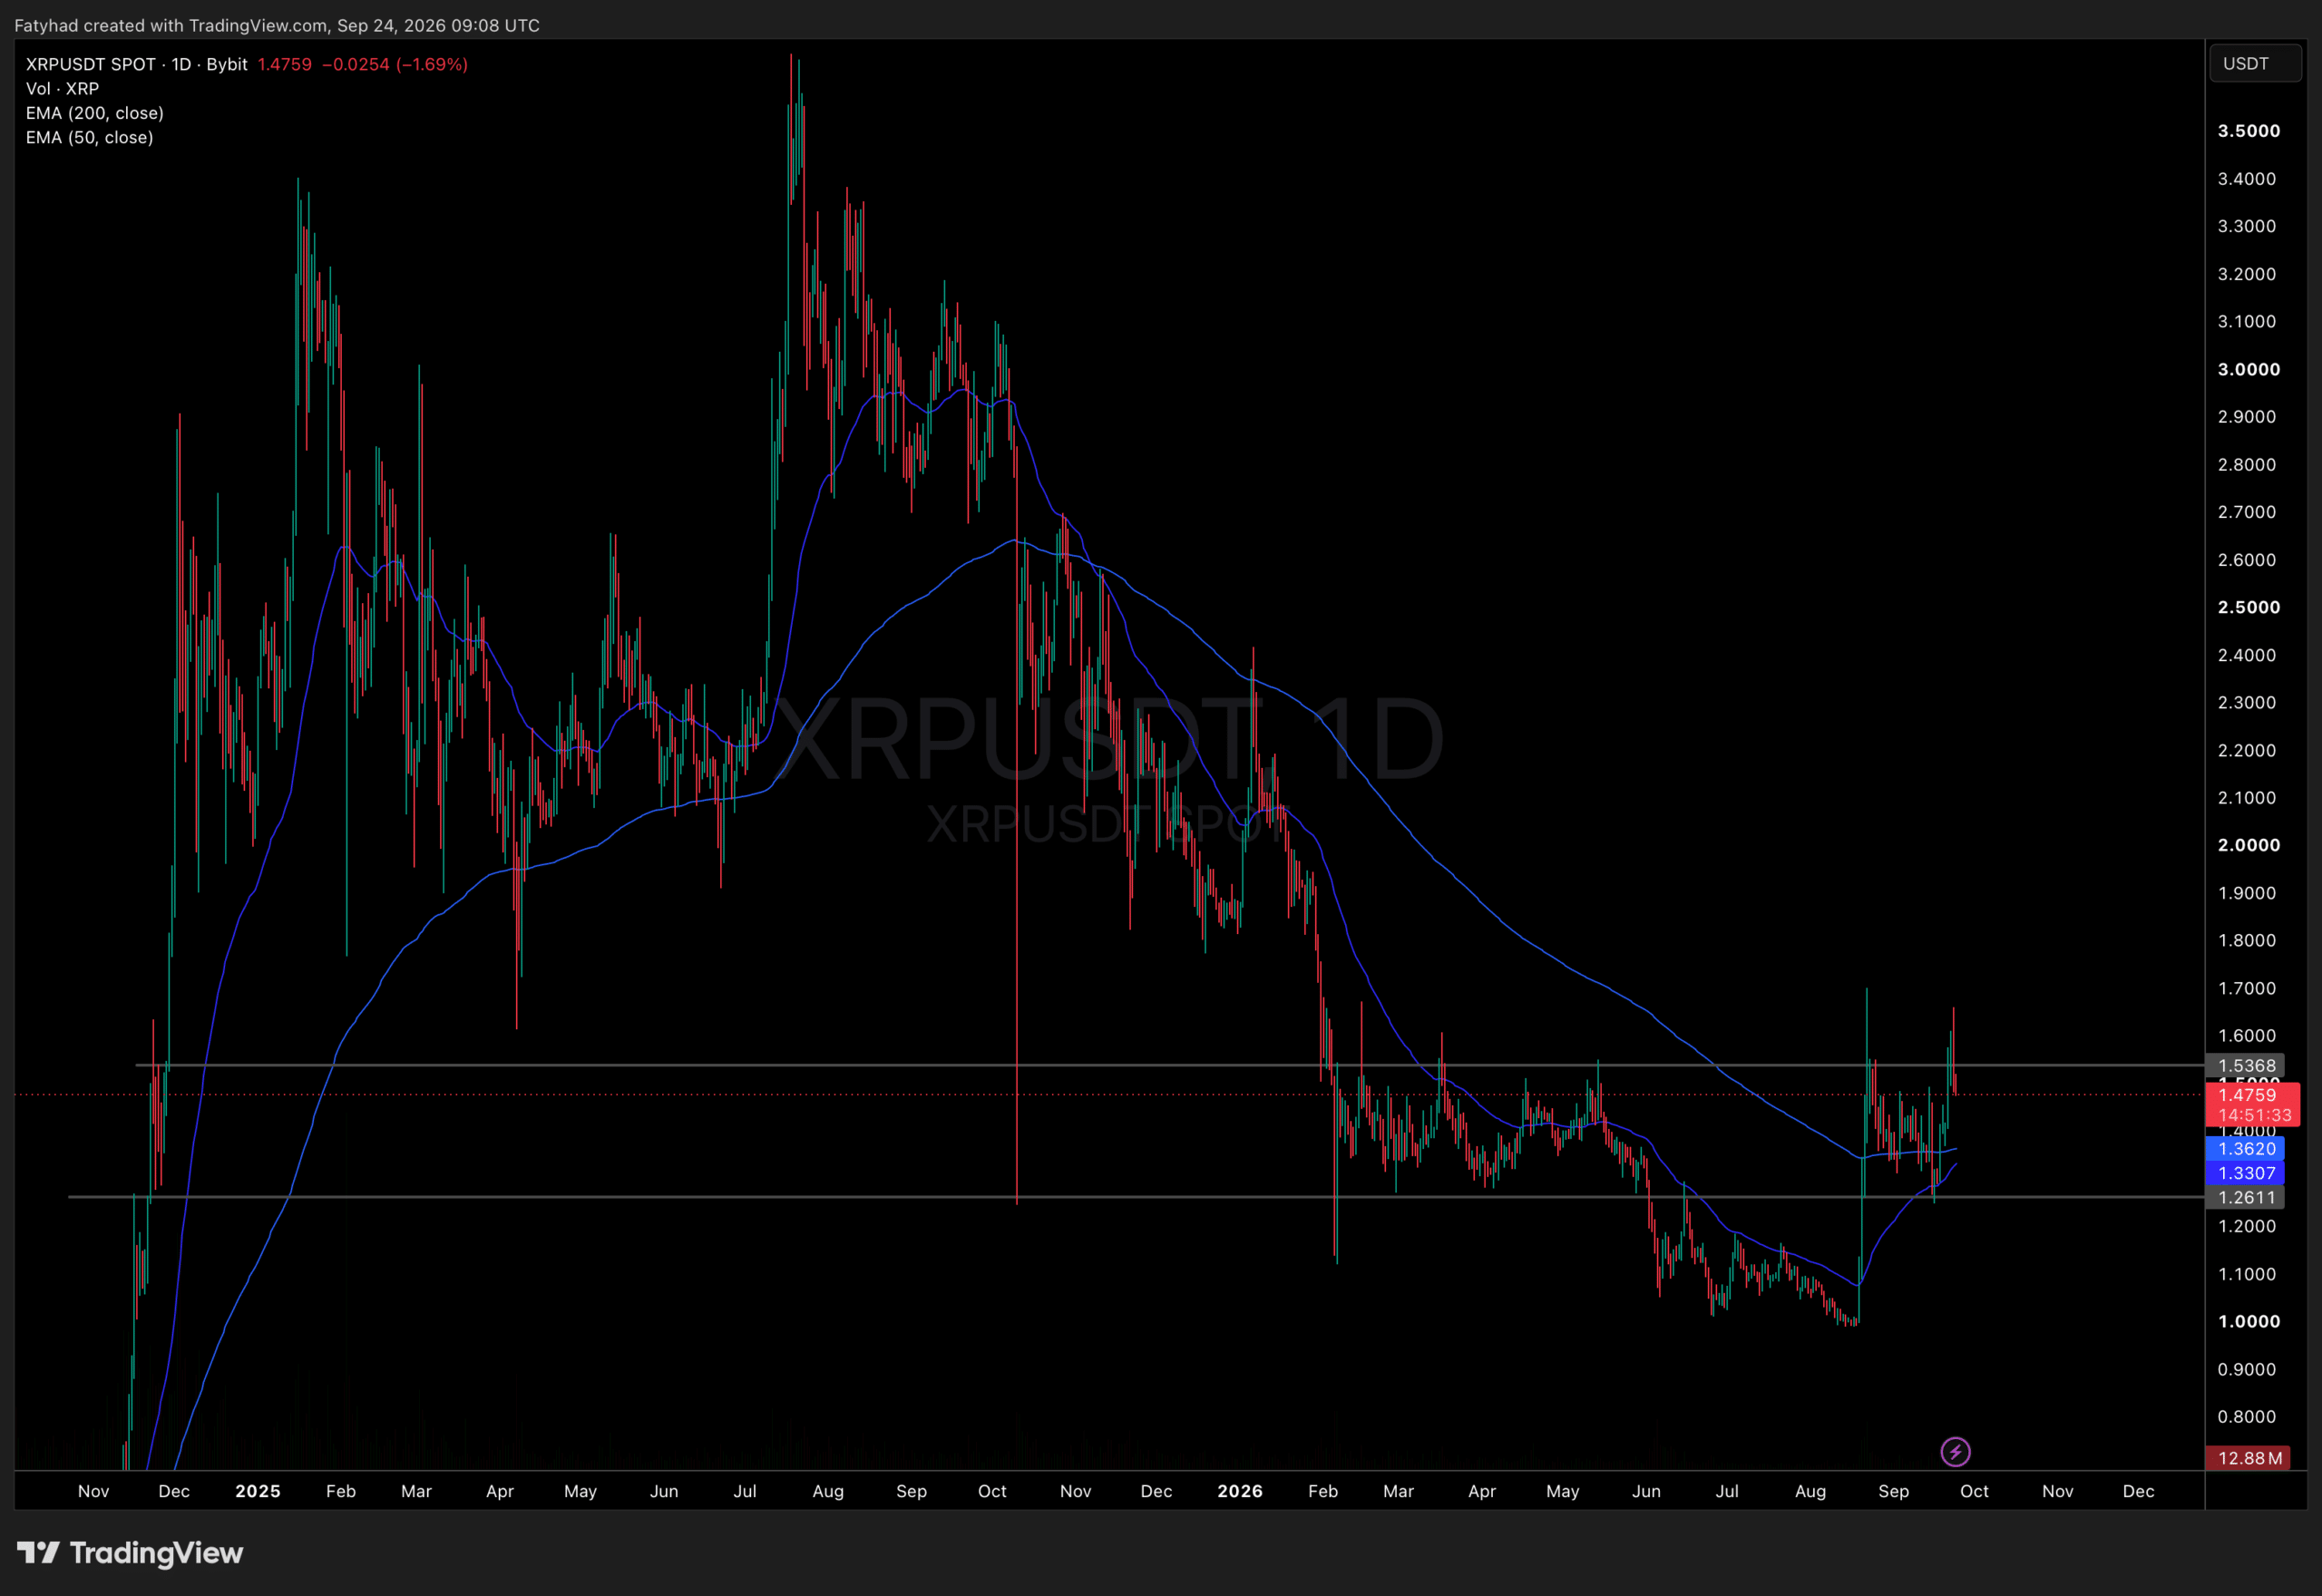
XRPUSDT Chart 1D TradingView
- Support to hold: $1.33–$1.36. Price reclaimed and sits above the 50-day and 200-day moving averages near this zone. The 50-day recently crossed above the 200-day.
- Critical downside level: $1.26. A breakdown below this prior range support would negate the August recovery.
- Resistance: $1.60. A daily close above $1.60 would clear supply and open $1.70.
XRP is consolidating between a defined ceiling and a converged moving-average floor. Mixed funding and ongoing ETF inflows indicate balanced positioning. The longer price compresses beneath $1.60 while support holds near the moving averages, the more forceful the eventual breakout or breakdown is likely to be.